


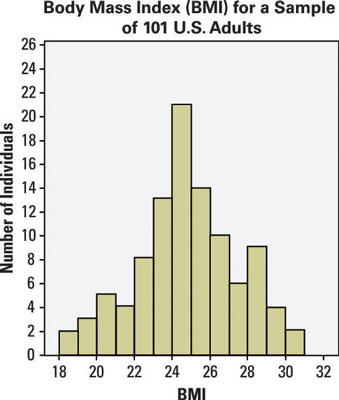
Pay special attention to how a histogram shows the variability in a data set. Flat histograms can have a lot of variability in the data, but flat time plots have none — that's one eye-opener. The following histogram represents the body mass index (BMI) of a sample of 101 U.S. adults.
Sample questions
Why are there no gaps between the bars of this histogram?
Answer: because the bars represent the distribution of continuous data
The bars in a histogram represent cutoff values of continuous data that takes on real numbers. Bars for categorical data stand for groups like male and female, which can be shown in either order.
What does the x-axis of this histogram represent?
Answer: the BMI scores
The x-axis represents the values of the variable: BMI scores, a continuous variable that, in this case, runs from 18 to 31.
What do the widths of the bars represent?
Answer: the range of BMI scores for each group in the bar
The BMI scores were divided into groups on the number line. The width of a bar represents the range of the BMI scores in that group.
What does the y-axis represent?
Answer: the number of adults with a BMI score in a particular range
The y-axis of a histogram represents how many individuals are in each group, either as a count (frequency) or as a percentage (relative frequency). In this case, the y-axis represents the number of adults (frequency) with a BMI score in the given range.
How would you describe the basic shape of this distribution?
Answer: approximately normal
The shape of this distribution is approximately normal because it has bell-shaped characteristics.
What is the range of the data in this histogram?
Answer: 18 to 31
You can see from the x-axis that the lowest bar has a lower bound of 18 and the highest bar has an upper bound of 31, so no data is outside that range.
Judging by this histogram, which bar contains the average value for this data (considering "average value" as similar to a balancing point)?
Answer: the seventh bar
The data is approximately symmetric (similar looking on each side of the mean) and is likely centered in the range of 24 to 25. This corresponds to the seventh bar on the histogram.
How many adults in this sample have a BMI in the range of 22 to 24?
Answer: 21
You can determine the number of people in each BMI range by the height of the bar. In this case, 8 are in the 22 to 23 range, and 13 are in the 23 to 24 range. Add these numbers to get your answer: 8 + 13 = 21.
What percentage of adults in this sample have a BMI of 28 or higher?
Answer: 15%
You can judge the number of people in each BMI range by the height of the bar. In this case, 9 are in the 28 to 29 range, 4 are in the 29 to 30 range, and 2 are in the 30 to 31 range. Add these numbers to get your answer: 9 + 4 + 2 = 15. Find the proportion by dividing by the total sample size (101) to get 0.15, then multiply by 100 to get the percentage (15%).
If you need more practice on this and other topics from your statistics course, visit 1,001 Statistics Practice Problems For Dummies to purchase online access to 1,001 statistics practice problems! We can help you track your performance, see where you need to study, and create customized problem sets to master your stats skills.


