
For example, take predicting numbers in the Texas Lotto. Every Wednesday and Saturday, the Texas Lottery commission picks six random numbered balls from a drum, and the person who matches the grand prize wins. One prospective client had been tracking the winning numbers for months and was convinced there was a pattern to it. The basis for his conviction was a graph he had created that looked something like this.
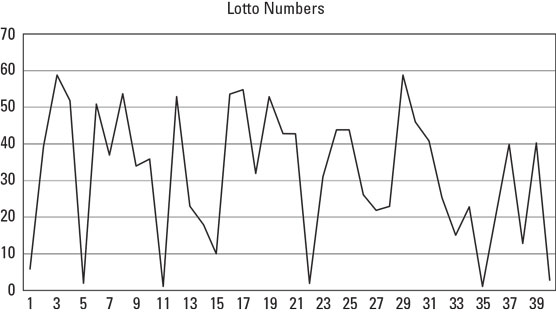 Lottery number patterns.
I looked at the chart he had diligently drawn and could feel his eyes on me. What we were looking at was as obvious to him as it was unclear to me. Finally, he said, “Look, the numbers just keep going up and down, over and over. I want you to write a computer program that describes that movement and predicts what the numbers will be next week.”
After a few minutes of digging into his “theories,” it was quite clear that he was doing what many gamblers do. He was doing the same thing as those ancient people who overlaid the shapes of their gods and myths in the constellations. He was doing the same thing that a soothsayer did with chicken entrails and the color of a comet tail. He had convinced himself that there was a pattern in a completely random set of numbers, and he was quite convinced that with a little help from a computer, he’d be on his way to lotto riches.
The fundamental assumption of randomness
So, back to the question: What if I’m looking at a set of completely random numbers that just happened to come up this way?In fact, it shouldn’t be a question; it should be an assumption. Sporting events, with all their wacky bounces and results that change because a player’s toe was a millimeter in the wrong direction, are mostly random events. So, it’s not a stretch to assume betting outcomes like moneylines, point spreads, and over/under bets are basically random too.
Sports bettors are confronted with assertions of non-randomness all the time. You might be looking at a win-loss record of a fellow bettor, or analyzing the spread results from an angle you found in the historical data for a team. Heck, it doesn’t have to be betting-related; it might just be someone arguing with you about certain players being more "clutch" than others.
More often than not, assertions of non-randomness are perfectly normal streaks that appear in totally random numbers.
Inserting randomness into sports assertions
Let’s dive deeper into the fundamental assertion of randomness. Embedded there is a well justified suspicion that the numbers sports fans and bettors bathe in every day are, in fact, meaningless. Let’s take a few common examples and explain why they it is perfectly sensible and non-cynical to chalk up each argument to randomness:- College basketball teams that lost their conference championship game are more likely to get beaten in the first game of the NCAA Tournament. In the last five years, those teams have lost 11 games and only won 7 in the first round of the tournament.
- The Cowboys come into tonight’s game with a turnover margin of –4 on the year, and the Saints are at –1. Clearly, being able to protect the ball better is an advantage for the Saints in their upcoming game.
- Bellinger bats .405 with runners in scoring position, so he will be a real threat in the game tonight if the top of the Dodgers lineup can get on base.
- Elliott’s yards per carry average is down this year from 4.8 yards to 4.3 yards, so clearly there is an issue either with him or the Cowboys’ offensive line.
- 7 wins and 11 losses doesn’t represent anything close to a statistically meaningful data set. You could flip a coin 18 times and quite easily come up with 7 heads and 11 tails.
- Sure, the Cowboys raw turnover number is lower than the Saints, but there are many possible explanations that make this argument nonsense. First, it is possible that turnovers are completely random events, in which case, teams will be randomly distributed along the bell curve, but their relative position to each other is not predictive. Second, the Saints have had their bye week while the Cowboys have not. Third, the Cowboys have played against much tougher defensive competition.
- Cody Bellinger hit .406 with runners in scoring position this season, but did you know he hit .431 on games after a rest day? Did you know he hits .289 against pitchers with odd numbered jerseys? Did you know he only hit .260 with a runner only on 3rd base, but he hit .418 with a runner on 2nd base or runners on 2nd and 3rd? There’s no pattern to be found here. Slice the data enough ways, and you’ll inevitably find one slice with a higher batting average.
- Maybe the Cowboys have played better defenses this year. Or there was that one game last year where the defender who was about to tackle Elliot for a loss tripped over his shoelaces. Most of all, Elliott and his offensive line could be performing just as objectively effectively as the year before, and the difference between 4.8 and 4.3 could simply be due to random variation. If you roll a pair of dice 50 times, you know each roll will be between 2 and 12, but a 50 second trial of 50 rolls could easily result in an average being .5 higher or lower than the first trial.
If you’re facing an argument by statistic, your sports rebuttal should have two parts:
- First, there may be circumstances that weaken the underlying statistical argument. This is most common in comparison arguments, where someone is showing you two measurements that, to be meaningful, require the circumstances to be identical.
- Second, look at the numbers themselves. Do the numbers really support the narrative being propounded? Or could they be the result of looking at a fortuitous window on a totally random process?
Descriptive versus predictive
A third part of rebutting sports arguments, which deserves its own subsection, is the idea of data being interesting but by no means an indicator about the future.The job of statistics is to describe the past. There is an abundance of tools that help you tell a story about existing data. Yay math! But a lovely and complete description of the past does not automatically equal a prediction of the future.
If you’re an NFL bettor, this essential truth is thrown in your face over and over again in the early part of the season when 2–0 teams lay an egg and 0–2 bust out with a 45-point performance. We have to constantly remind ourselves that next season will be very different from the last season, and the next game is likely to not resemble the last one.“Pat Mahomes has passed for more yardage than the previous week for three consecutive games” is the kind of statement that masquerades as being predictive, but it is really nothing more than an interesting descriptive statement about the past.
Take a pair of dice and roll it a few times. In one of your trials, you’ll get a couple of low numbers to start with. Imagine a sports pundit telling you that because you rolled a 2, 5, and 6 to start with, it’s clear that those dice are "above average" and "are performing better than normal dice because they’re averaging north of 3.5." Is it possible your dice are extra awesome? Sure. But it’s much more likely you’re just looking at a narrow slice of a larger non-pattern of randomness.
Again, these questions are among the most important you can make a habit of asking: Is it possible I’ve assigned meaning to a random process? Have I looked at enough data to justify the conclusion I’m drawing? Are there circumstances that invalidate a numerical comparison? And finally, even if a pattern is evident, do I have reason to believe it is predictive or merely descriptive?
The statistical numeracy that you build in this article and hopefully from other sources, is designed to answer that question. I call it the fundamental question because it is so very important. At the heart of any sports bettor’s work is an attempt to separate signal from noise. If you want to win, you want to be able to tease out predictive and meaningful information from an ocean of meaningless numbers.Predictably random: The bell curve
If you’re a visual person and you want to understand how randomness works, the bell curve is a valuable aid. If you’re not familiar with the bell curve, it’s the shape that’s created when you graph the results of a finite number of trials of normally random numbers.A trial is a fixed length set of repeated experiments, such as 10 flips of a coin, 20 rolls of a pair of dice, or 30 baseball games. Each event has one or more associated measurement (respectively, the number of heads, the total value of all dice rolls, and the number of runs, hits, errors, or a zillion other possible metrics).
When a random number is normally distributed, that just means it’s a variable, like test scores or batting averages, that center around a certain most likely outcome. When you have repeated trials of events, normally distributed variables produce a bell-shaped pattern based on the probabilities of the outcomes of your experiment.
Let’s use a coin to demonstrate this. Take a worn out fair coin and flip it 100 times. You know intuitively that the average result of 100 flips will be 50 heads. But you also know that in any single trial of 100 flips, you’re unlikely to get exactly 50 heads. But you will certainly get results that seem to orbit around 50 heads: sometimes 46, sometimes 58, sometimes 49. And most important, the farther you get from 50 — higher or lower — the more rare that number comes up. Occasionally you’ll be in the 40s and 60s, and once in a blue moon, your heads will be in the 30s or 70s.
If you graphed the result of each trial of 100 coin flips, where the horizontal axis is the number of heads and the vertical axis is the number of times that head count has come up, your graph would start to look like the curve shown.
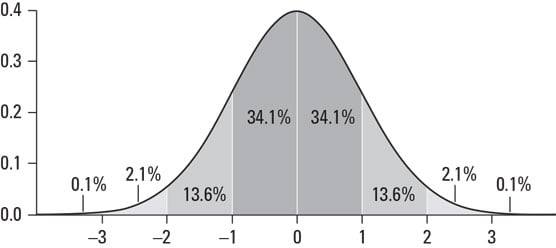 A bell curve of coin flip results.
With the first few trials, the curve won’t resemble anything. But inevitably, the more trials you measure, the more clearly the bell curve will be outlined. Every bell curve has a few descriptive statistics that you’ll want to get to know:
- The mean is the apex of the curve, also known as the average value, around which all other results cluster. Track 100 flip trials of a coin and the bell curve will cluster around 50 heads because 50 is that’s the halfway mark between getting 0 heads and getting 100 heads.
Just because the mean is at the top of the bell curve doesn’t mean it’s a likely result. In fact, it would be quite rare for you to flip a coin 100 times and get exactly 50 heads and 50 tails. But the mean represents the most likely outcome relative to all other outcomes.
- Another aspect of the bell curve is its variance, which is the amount to which values cluster tightly around the mean. We often express the amount of variance with the more useful mathematical term called standard deviation. Your curve can be skinny and tall, or it can be shorter and wider, but it’s still a bell curve, and that makes it useful for statistical analysis.