It's important to remember many academics take strong exception to technical analysis. Studies have shown a stock price's movement in the short term is tied to news events, which are random. Stock price charts, academics say, tell you nothing other than what a price was in the past — which isn't all that helpful in predicting the future. Longer-term stock prices respond to a company's earnings and cash flow, which are not predicted by anything on a stock price chart, many academics insist.
Sometimes it does seem technical analysts get a bit carried away with the art of their craft. Some technical analysts read stock price charts almost like a clairvoyant studies the lines on a client's palm. With that said, technical analysis is often mentioned by investors, so it's worth knowing a bit about. More importantly for fundamental analysts, though, is that some of the methods used by technical analysts may be useful for investors who are focused on revenue and earnings.Reading the stock price charts
The primary tool used by technical analysts is the stock price chart. These charts, available on just about any financial website, usually plot a stock's closing price every day. Charts usually come in several forms, including the:- Line: Most of the stock price charts you see are usually line charts. Line charts, as their name implies, are simply a connect-the-dots line linking the closing prices of a stock each trading day.
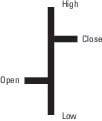
- High-Low-Close: Line charts are simple, but they do obscure some of the relevant data from trading. If you look at a line chart, there's no way to know how high or low stock prices got each day. The High-Low-Close chart, shown here, attempts to solve this shortcoming of line charts. On each trading day, there's a vertical bar, with the top portion representing a stock's high price and the bottom, the low. Then there's a line through the middle of the bar showing the price at which the stock closed.
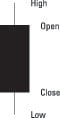
- Candlestick: Candlestick charts pack even more information than line or high-low-close charts. Candlestick charts not only show you a stock's high, low, and close, but also its open price. A stock's open price is the very first price in a trading day that buyers and sellers agreed upon. The indicator on a candlestick chart looks like a rectangle with a vertical line protruding from the top, to mark the stock's high, and from the bottom, to mark the low. You can take a look at a sample here.
What technical analysts are looking for in the charts
If you've ever heard a technical analyst speak, it might seem like a bit of voodoo. Usually, technical analysts have a pen or marker in hand, start scribbling all over a price chart and talk about all sorts of patterns that they see. If you've ever been to a star-gazing presentation at an observatory, you probably get an idea of what it's like hearing a technical analyst describe a stock chart. Technical analysts try to connect dots on charts to find patterns they say can be revealing about a stock's future. Technical analysts are looking for several things in the charts, including:- Price patterns: If there's one thing technical analysts fixate on, it's the shape of the charts. Technical analysts think investors, being human, follow predictable cycles of fear and greed. These emotions cause stock prices to follow predictable scripts, or patterns, that may indicate where the stock is headed.
- What other people see: Even if you do all the fundamental research possible, you can still be dead wrong. Technical analysts attempt to look at a stock chart to either confirm or deny their belief about a stock's future. If a stock is in free fall, technical analysts would assume other investors know something they don't and would avoid it.
- Support and resistance levels: Through the constant tug-of-war between buyers and sellers, a stock attempts to settle at a price investors agree upon. Sometimes a stock will have difficultly breaking beyond a high point, or resistance level, and will routinely bounce off a low point, called a support level.
- Momentum: Technical investors, who are often short-term traders or speculators, often try to capitalize on the tendency of some stocks to gain steam either going up or heading down. If a stock starts to rally, technical investors take notice and assume those in the know expect the company to report something positive.
How technical analysis differs from fundamental analysis
Technical analysts and fundamental analysts are sometimes at odds with one other. Technical analysts believe all information about a stock that's worth knowing is reflected in its stock price. Taking the time to study a company's fundamentals is a waste of time, a pure technical analyst would argue, because everyone else has access to the same information and has either bought or sold the stock already.Those are fighting words to fundamental analysts. Fundamental analysts, on the other hand, claim technical analysts fall victim to groupthink and fixate on changes in stock prices that tell investors nothing about the future. What's more, fundamental analysts claim stock prices can get overvalued when investors become too optimistic about a stock and push its price above or below the company's intrinsic value.