

Measures of central tendency
Measures of central tendency show the center of a data set. Three of the most commonly used measures of central tendency are the mean, median, and mode.
Mean
Mean is another word for average. Here is the formula for computing the mean of a sample:

With this formula, you compute the sample mean by simply adding up all the elements in the sample and then dividing by the number of elements in the sample.
Here is the corresponding formula for computing the mean of a population:

Although the notation is slightly different, the procedure for computing a population mean is the same as the procedure for computing a sample mean.
Greek letters are used to describe populations, whereas Roman letters are used to describe samples.
Median
The median of a data set is a value that divides the data into two equal halves. In other words, half of the elements of a data set are less than the median, and the remaining half are greater than the median. The procedure for computing the median is the same for both samples and populations.
Mode
The mode of a data set is the most commonly observed value in the data set. You determine the mode in the same way for a sample and a population.
Measures of central dispersion
Measures of central dispersion show how “spread out” the elements of a data set are from the mean. Three of the most commonly used measures of central dispersion include the following:
-
Range
-
Variance
-
Standard deviation
Range
The range of a data set is the difference between the largest value and the smallest value. You compute it the same way for both samples and populations.
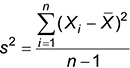
Variance
You can think of the variance as the average squared difference between the elements of a data set and the mean. The formulas for computing a sample variance and a population variance are slightly different.
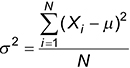
Here is the formula for computing sample variance:
And here is the formula for computing population variance:
Standard deviation
The standard deviation is simply the square root of the variance. It’s more commonly used as a measure of dispersion than the variance because it’s measured in the same units as the elements of the data set, whereas the variance is measured in squared units.
Measures of association
Measures of association quantify the strength and the direction of the relationship between two data sets. Here are the two most commonly used measures of association:
-
Covariance
-
Correlation
Both measures are used to show how closely two data sets are related to each other. The main difference between them is the units in which they are measured. The correlation measure is defined to assume values between –1 and 1, which makes interpretation very easy.
Covariance
The covariance between two samples is computed as follows:

The covariance between two populations is computed as follows:

Correlation
The correlation between two samples is computed like this:
![]()
The correlation between two populations is computed like this:
![]()
