


One of the challenges you can encounter when building data models in Excel is a data table that expands over time. That is to say, the table grows in the number of records it holds due to new data being added. To get a basic understanding of this challenge, take a look at the following figure.
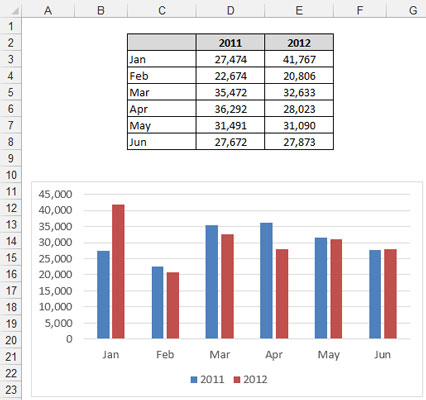
In this figure, you see a simple table that serves as the source for the chart. Notice that the table lists data for January through June.
Imagine that next month, this table expands to include July data. You'll have to manually update your chart to include July data. Now imagine you had this same issue across your data model, with multiple data tables that link to multiple staging tables and dashboard components. You can imagine it'd be an extremely painful task to keep up with changes each month.
To solve this issue, you can use Excel's Table feature (you can tell they spent all night coming up with that name). The Table feature allows you to convert a range of data into a defined table that's treated independently of other rows and columns on the worksheet. After a range is converted to a table, Excel views the individual cells in the table as a single object with functionality that a typical data range doesn't have.
For instance, Excel tables offer the following features:
They're automatically enabled with Filter drop-down headers so that you can filter and sort easily.
They come with the ability to quickly add a Total row with various aggregate functions.
You can apply special formatting to Excel tables independent of the rest of the spreadsheet.
Most important for data modeling purposes, they automatically expand to allow for new data.
The Table feature exists in Excel 2003 under a different name: the List feature (found on Excel's Data menu). The benefit of this fact is that Excel tables are fully compatible with Excel 2003 Lists.
Converting a range to an Excel table
To convert a range of data to an Excel table, follow these steps:
Highlight the range of cells that contain the data you want included in your Excel table.
On the Insert tab of the Ribbon, click the Table button.
This step opens the Create Table dialog box.
In the Create Table dialog box, verify the range for the table and specify whether the first row of the selected range is a header row.
Click OK to apply the changes.
 Converting a range of data to an Excel table.
After the conversion takes place, notice a few small changes. Excel has put autofilter drop-downs on the header rows, the rows in the table now have alternate shading, and any header that didn't have a value has been named by Excel.
You can use Excel tables as the source for charts, pivot tables, list boxes, or anything else for which you'd typically use a data range. In the following figure, a chart has been linked to the Excel table.
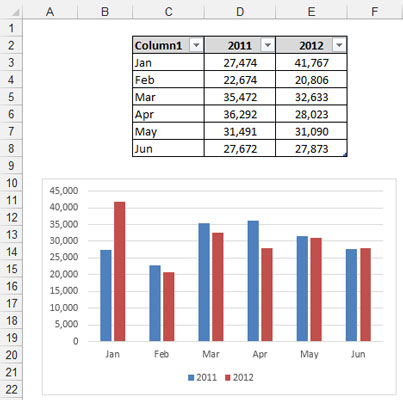
Here's the impressive bit. When data is added to the table, Excel automatically expands the range of the table and incorporates the new range into any linked object. That's just a fancy way of saying that any chart or pivot table tied to an Excel table automatically captures new data without manual intervention.
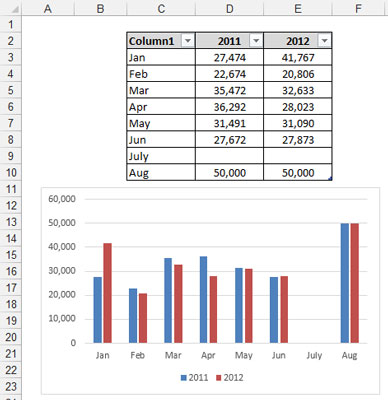
For example, if you add July and August data to the end of the Excel table, the chart automatically updates to capture the new data. In the following figure, July is added with no data and August with data to show you that the chart captures any new records and automatically plots the data given.
Take a moment to think about what Excel tables mean to a data model. They mean pivot tables that never have to be reconfigured, charts that automatically capture new data, and ranges that automatically keep up with changes.
Converting an Excel table back to a range
If you want to convert an Excel table back to a range, you can follow these steps:
Place the cursor in any cell inside the Excel table and select the Table Tools' Design subtabs on the Ribbon.
Click the Convert to Range button, as shown.
When asked if you're sure (via a message box), click the Yes button.
 To remove Excel table functionality, convert the table back to a range.

