


The Excel Data Analysis add-in provides three tools for working with t-values and t-tests, which can be very useful when you want to make inferences about very small data sets:
t-Test: Paired Two Sample for Means
t-Test: Two-Sample Assuming Equal Variances
t-Test: Two-Sample Assuming Unequal Variances
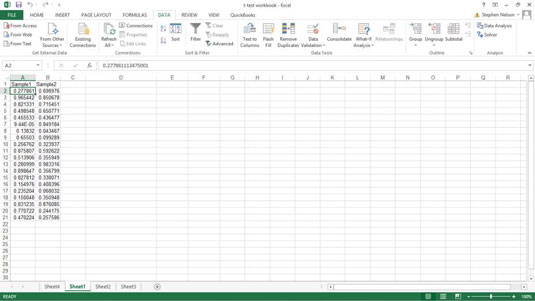
Briefly, here’s how these three tools work. For sake of illustration, assume that you’re working with these values. The worksheet range A1:A21 contains the first set of values. The worksheet range B1:B21 contains the second set of values.
To perform a t-test calculation, follow these steps:
Choose Data tab’s Data Analysis.
When Excel displays the Data Analysis dialog box, select the appropriate t-test tool from its Analysis Tools list.
t-Test: Paired Two-Sample For Means: Choose this tool when you want to perform a paired two-sample t-test.
t-Test: Two-Sample Assuming Equal Variances: Choose this tool when you want to perform a two-sample test and you have reason to assume the means of both samples equal each other.
t-Test: Two-Sample Assuming Unequal Variances: Choose this tool when you want to perform a two-sample test but you assume that the two-sample variances are unequal.

After you select the correct t-test tool, click OK.
Excel then displays the appropriate t-test dialog box. Here’s the t-Test: Paired Two Sample Assuming Equal Variances dialog box.
The other t-test dialog boxes look very similar.

In the Variable 1 Range and Variable 2 Range input text boxes, identify the sample values by telling Excel in what worksheet ranges you've stored the two samples.
You can enter a range address into these text boxes. Or you can click in the text box and then select a range by clicking and dragging. If the first cell in the variable range holds a label and you include the label in your range selection, of course, select the Labels check box.
Use the Hypothesized Mean Difference text box to indicate whether you hypothesize that the means are equal.
If you think the means of the samples are equal, enter 0 (zero) into this text box. If you hypothesize that the means are not equal, enter the mean difference.
In the Alpha text box, state the confidence level for your t-test calculation.
The confidence level is between 0 and 1. By default, the confidence level is equal to 0.05, which is equivalent to a 5-percent confidence level.
In the Output Options section, indicate where the t-test tool results should be stored.
Select one of the radio buttons and enter information in the text boxes to specify where Excel should place the results of the t-test analysis. For example, to place the t-test results into a range in the existing worksheet, select the Output Range radio button, and then identify the range address. If you want to place the t-test results elsewhere, select one of the other option radio buttons.
Click OK.
Excel calculates the t-test results. Check out the t-test results for a Paired Two Sample Assuming Equal Variances test. The t-test results show the mean for each of the data sets, the variance, the number of observations, the pooled variance value, the hypothesized mean difference, the degrees of freedom (abbreviated as df), the t-value (or t-stat), and the probability values for one-tail and two-tail tests.


