


Click any single cell inside the data source; it's the table you use to feed the pivot table. If you're following along, the data source would be the table found on the Sample Data tab.
Select the Insert tab on the Ribbon.
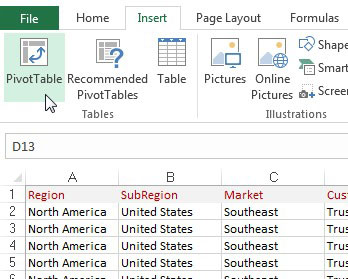
Here, find the PivotTable icon. Choose PivotTable from the drop-down list beneath the icon. This step opens the Create PivotTable dialog box.
Excel makes an attempt to fill in the range of your data for you. Always make sure that the correct range is selected.
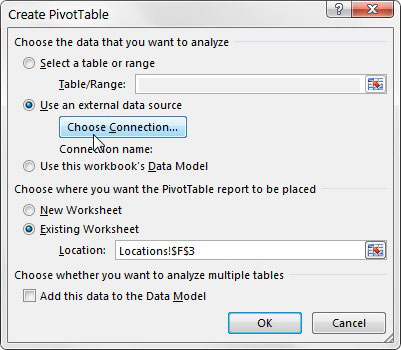
As you can see, this dialog box asks you to specify the location of the source data and the place where you want to put the pivot table.
Also note that the default location for a new pivot table is New Worksheet. This means your pivot table is placed in a new worksheet within the current workbook. You can change this by selecting the Existing Worksheet option and specifying the worksheet where you want the pivot table placed.
Click OK.
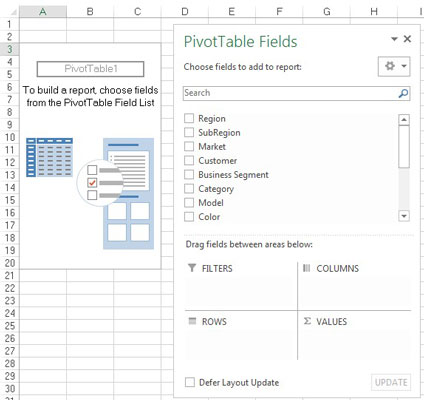
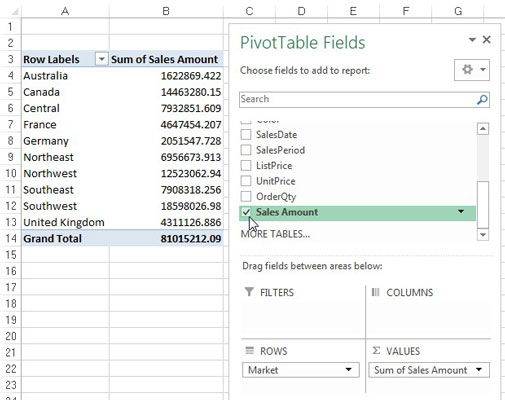
At this point, you have an empty pivot table report on a new worksheet. Next to the empty pivot table, you see the PivotTable Fields dialog box.
The idea here is to add the fields you need into the pivot table by using the four drop zones found in the PivotTable Field List: Filters, Columns, Rows, and Values. Pleasantly enough, these drop zones correspond to the four areas of the pivot table.
If clicking the pivot table doesn’t open the PivotTable Fields dialog box, you can manually open it by right-clicking anywhere inside the pivot table and selecting Show Field List.
Now, before you go wild and start dropping fields into the various drop zones, you should ask yourself two questions: “What am I measuring?” and “How do I want to see it?” The answers to these questions give you some guidance when determining which fields go where.
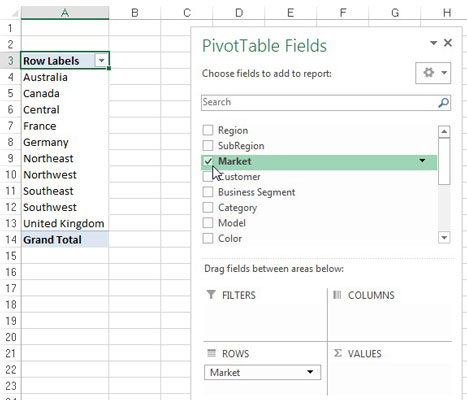
For your first pivot table report, measure the dollar sales by market. This automatically tells you that you need to work with the Sales Amount field and the Market field.
How do you want to see that? You want markets to be listed down the left side of the report and the sales amount to be calculated next to each market. Remembering the four areas of the pivot table, you need to add the Market field to the Rows drop zone and add the Sales Amount field to the Values drop zone.
Select the Market check box in the list.
Now that you have regions in the pivot table, it’s time to add the dollar sales.
Select the Sales Amount check box in the list.
Selecting a check box that is non-numeric (text or date) automatically places that field into the row area of the pivot table. Selecting a check box that is numeric automatically places that field in the values area of the pivot table.
What happens if you need fields in the other areas of the pivot table? Well, rather than select the field’s check box, you can drag any field directly to the different drop zones.
One more thing: When you add fields to the drop zones, you may find it difficult to see all the fields in each drop zone. You can expand the PivotTable Fields dialog box by clicking and dragging the borders of the dialog box.
As you can see, you have just analyzed the sales for each market in just a few steps! That’s an amazing feat, considering that you start with more than 60,000 rows of data. With a little formatting, this modest pivot table can become the starting point for a management report.


