

A quantile-quantile plot (also known as a QQ-plot) is another way you can determine whether a dataset matches a specified probability distribution. QQ-plots are often used to determine whether a dataset is normally distributed. Graphically, the QQ-plot is very different from a histogram. As the name suggests, the horizontal and vertical axes of a QQ-plot are used to show quantiles.
Quartiles divide a dataset into four equal groups, each consisting of 25 percent of the data. But there is nothing particularly special about the number four. You can choose any number of groups you please.
Another popular type of quantile is the percentile, which divides a dataset into 100 equal groups. For example, the 30th percentile is the boundary between the smallest 30 percent of the data and the largest 70 percent of the data. The median of a dataset is the 50th percentile of the dataset. The 25th percentile is the first quartile, and the 75th percentile the third quartile.
With a QQ-plot, the quantiles of the sample data are on the vertical axis, and the quantiles of a specified probability distribution are on the horizontal axis. The plot consists of a series of points that show the relationship between the actual data and the specified probability distribution. If the elements of a dataset perfectly match the specified probability distribution, the points on the graph will form a 45 degree line.
For example, this figure shows a normal QQ-plot for the price of Apple stock from January 1, 2013 to December 31, 2013.
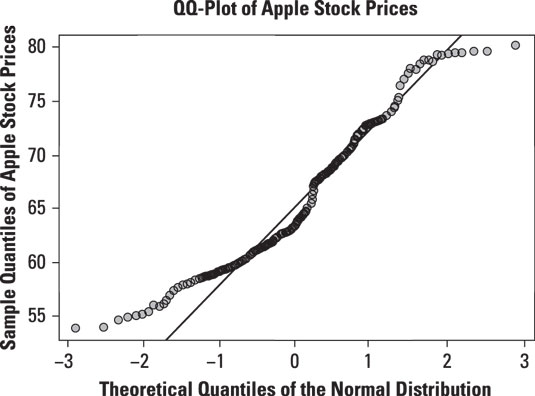
The QQ-plot shows that the prices of Apple stock do not conform very well to the normal distribution. In particular, the deviation between Apple stock prices and the normal distribution seems to be greatest in the lower left-hand corner of the graph, which corresponds to the left tail of the normal distribution. The discrepancy is also noticeable in the upper right-hand corner of the graph, which corresponds to the right tail of the normal distribution.
The graph shows that the smallest prices of Apple stock are not small enough to be consistent with the normal distribution; similarly, the largest prices of Apple stock are not large enough to be consistent with the normal distribution. This shows that the tails of the Apple stock price distribution are too "thin" or "skinny" compared with the normal distribution. The conclusion to be drawn from this is that the Apple stock prices are not normally distributed.
This figure shows a normal QQ-plot for the daily returns to Apple stock from January 1, 2013 to December 31, 2013:
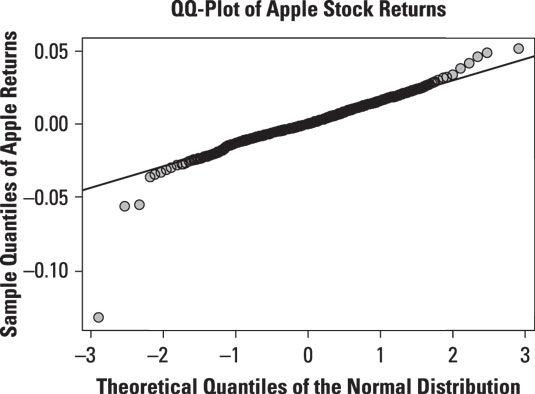
The QQ-plot shows that the returns to Apple stock do not conform to the normal distribution, either. In this case, the smallest returns to Apple stock are too small to be consistent with the normal distribution. Similarly, the largest returns to Apple stock are too large to be consistent with the normal distribution. This shows that the tails of the Apple return distribution are too "thick" or "fat" compared with the normal distribution. Therefore, Apple returns are not normally distributed.
In many applications, the returns to financial assets are assumed to be normally distributed, but in actual practice, these returns tend to have "fat" tails. With a fat-tailed distribution, extremely large or small outcomes occur more frequently than they would with the normal distribution. There are ways of transforming the data to bring it more in line with the normal distribution.


