


Hypothesis testing can seem like a plug-and-chug operation, but that can take you only so far. Remember that a small p-value comes from a large test statistic, and both mean rejecting H0. Calculate p-values in the following problems.
Sample questions
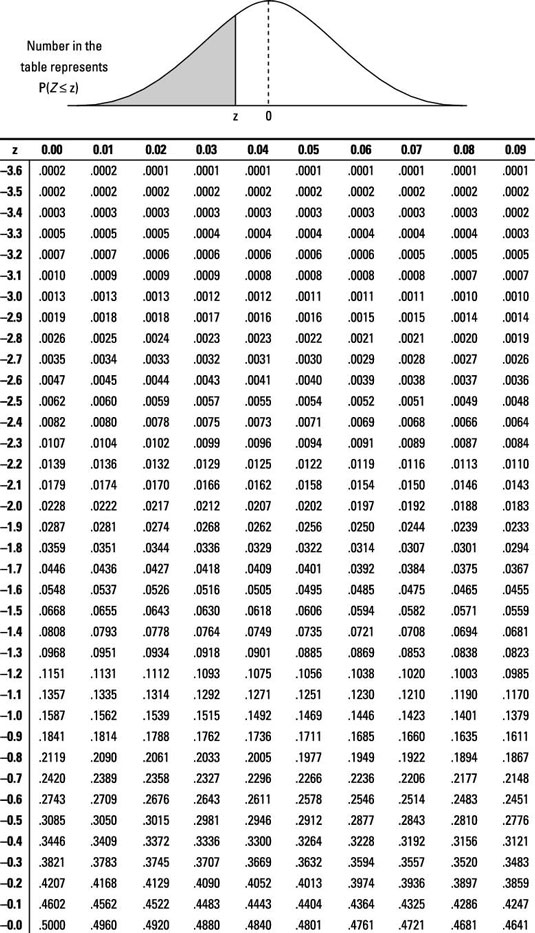
A researcher has a less than alternative hypothesis and wants to run a single sample mean z-test. The researcher calculates a test-statistic of z = –1.5 and then uses a Z-table to find a corresponding area of 0.0668, which is the area under the curve to the left of that value of z.
What is the p-value in this case?
Answer: 0.0668
Using the z-table, find –1.5 in the left-hand column, and then go across the row to the column for 0.00, where the value is 0.0668. This is the proportion of the curve area that's to the left of (less than) the test statistic value of z that you're looking up. In this case, the alternative hypothesis is a less than hypothesis, so you can read the p-value from the table without doing further calculations.
Suppose that a researcher has a not equal to alternative hypothesis and calculates a test statistic that corresponds to z = –1.5 and then finds, using a Z-table, a corresponding area of 0.0668 (the area under the curve to the left of that value of z).
What is the p-value in this case?
Answer: 0.1336
Using the z-table, find –1.5 in the left-hand column, and then go across the row to the column for 0.00, where the value is 0.0668. This is the proportion of the curve area that's to the left of (less than) the value of z you're looking up.
In this case, the alternative hypothesis is a not equal to hypothesis, so you double the outlying tail quantity (area below the z-value of –1.5) to get the p-value.
A researcher has a not equal to alternative hypothesis and calculates a test statistic that corresponds to z = –2.0. Using a Z-table, the researcher finds a corresponding area of 0.0228 to the left of –2.0.
What is the p-value in this case?
Answer: 0.0456
Using the z-table, find –2.0 in the left-hand column, and then go across the row to the column for 0.0, where the value is 0.0228. This is the proportion of the curve area that's to the left of (less than) the value of z you're looking up.
In this case, the alternative hypothesis is a not equal to hypothesis, so you double the outlying tail quantity (area below the z-value of –2.0) to get the p-value.
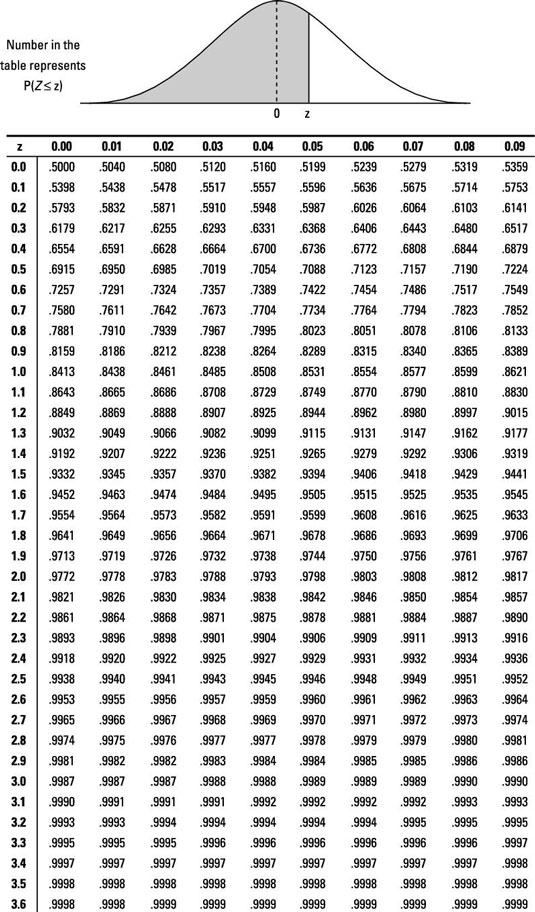
A scientist with a not equal to alternative hypothesis calculates a test statistic that corresponds to z = 1.1. Using a Z-table, the scientist finds that this corresponds to a curve area of 0.8643 (to the left of the test statistic value).
What is the p-value in this case?
Answer: 0.2714
Using the z-table, find 1.1 in the left-hand column, then go across the row to the column for 0.0, where the value is 0.8643. This is the area under the curve to the left of the z value of 1.1. Because total area under the curve equals 1, the area above z in this case is 1 – 0.8643 = 0.1357.
In this case, the alternative hypothesis is a not equal to hypothesis, so you double the outlying tail quantity (area above the z-value of 1.1) to get the p-value.
If you need more practice on this and other topics from your statistics course, visit 1,001 Statistics Practice Problems For Dummies to purchase online access to 1,001 statistics practice problems! We can help you track your performance, see where you need to study, and create customized problem sets to master your stats skills.


