


You might need to references the Z-table to solve the following questions.
Sample questions
For the following questions, consider that in a population of adults ages 18 to 65, BMI (body mass index) is normally distributed with a mean of 27 and a standard deviation of 5.
What is the BMI score for which half of the population has a lower value?
Answer: 27
In this case, using intuition is very helpful. If you have a normal distribution for the population, then half of the values lie below the mean (because it's symmetrical and the total percentage is 100%). Here, the mean is 27, so 50%, or half, of the population of adults has a BMI lower than 27.
What BMI marks the bottom 25% of the distribution for this population?
Answer: 23.65
You want to find the value of X (BMI) where 25% of the population lies below it. In other words, you want to find the 25th percentile of X. First, you need to find the 25th percentile for Z (using the Z-table) and then change the z-value to an x-value by using the z-formula:

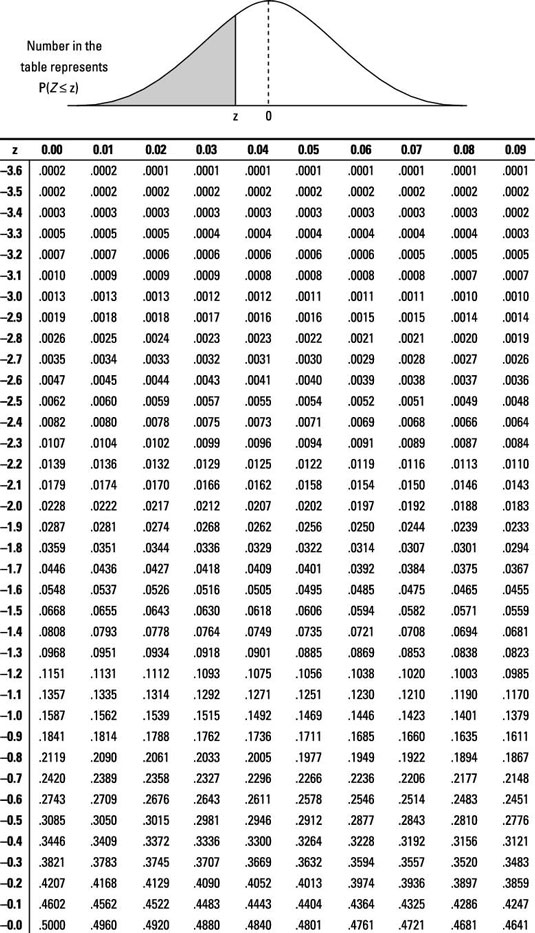
To find the 25th percentile for Z (or the cutoff point where 25% of the population lies below it), look at the Z-table and find the probability that's closest to 0.25.
The probabilities for the Z-table are the values inside the table. The numbers on the outsides that tell which row/column you're in are actual z-values, not probabilities.
Searching the Z-table, you see that the closest probability to 0.25 is 0.2514.
Next, find what z-score this probability corresponds to. After you've located 0.2514 inside the table, find its corresponding row (–0.6) and column (0.07). Put these numbers together and you get the z-score of –0.67. This is the 25th percentile for Z. In other words, 25% of the z-values lie below –0.67.
To find the corresponding BMI that marks the 25th percentile, use the z-formula and solve for x. You know that


So 25% of the population has a BMI lower than 23.65.
What BMI marks the bottom 5% of the distribution for this population?
Answer: 18.80
You want to find the value of X (BMI) where 5% of the population lies below it. In other words, you want to find the 5th percentile of X. First, you need to find the 5th percentile for Z (using the Z-table) and then change the z-value to an x-value by using the z-formula:
To find the 5th percentile for Z (or the cutoff point where 5% of the population lies below it), look at the Z-table and find the probability that's closest to 0.05.
You see that the closest probability to 0.05 is either 0.0495 or 0.0505 (use 0.0505 in this case).
Next, find what z-score this probability corresponds to. After you've located 0.0505 inside the table, find its corresponding row (–1.6) and column (0.04). Put these numbers together and you get the z-score of –1.64. This is the 5th percentile for Z. In other words, 5% of the z-values lie below –1.64.
To find the corresponding BMI that marks the 5th percentile, use the z-formula and solve for x.

So 5% of the population has a BMI lower than 18.80.
If you need more practice on this and other topics from your statistics course, visit 1,001 Statistics Practice Problems For Dummies to purchase online access to 1,001 statistics practice problems! We can help you track your performance, see where you need to study, and create customized problem sets to master your stats skills.


