Graphing an exponential function is helpful when you want to visually analyze the function. Doing so allows you to really see the growth or decay of what you’re dealing with. The basic parent function of any exponential function is f(x) = bx, where b is the base.
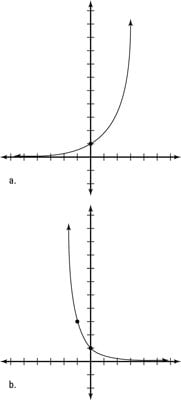
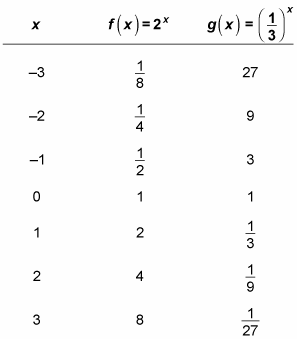
Figure a, for instance, shows the graph of f(x) = 2x, and Figure b shows
Using the x and y values from this table, you simply plot the coordinates to get the graphs.
The parent graph of any exponential function crosses the y-axis at (0, 1), because anything raised to the 0 power is always 1. Some teachers refer to this point as the key point because it’s shared among all exponential parent functions.
Because an exponential function is simply a function, you can transform the parent graph of an exponential function in the same way as any other function:
where a is the vertical transformation, h is the horizontal shift, and v is the vertical shift.
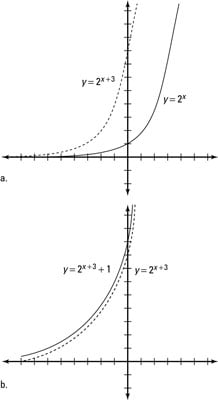
For example, you can graph h(x) = 2(x+3) + 1 by transforming the parent graph of f(x) = 2x. Based on this equation, h(x) has been shifted three to the left (h = –3) and shifted one up (v = 1). This figure shows each of these as steps: Figure a is the horizontal transformation, showing the parent function y = 2x as a solid line, and Figure b is the vertical transformation.
Moving an exponential function up or down moves the horizontal asymptote. The function in Figure b has a horizontal asymptote at y = 1. This change also shifts the range up 1 to