


The evidence in the trial is your data and the statistics that go along with it. All hypothesis tests ultimately use a p-value to weigh the strength of the evidence (what the data are telling you about the population). The p-value is a number between 0 and 1 and is interpreted in the following way:
- A small p-value (typically ≤ 0.05) indicates strong evidence against the null hypothesis, so you reject it.
- A large p-value (> 0.05) indicates weak evidence against the null hypothesis, so you fail to reject it.
- P-values very close to the cutoff (0.05) are considered to be marginal (could go either way). Always report the p-value so your readers can draw their own conclusions.
How to find a p-value from a test statistic
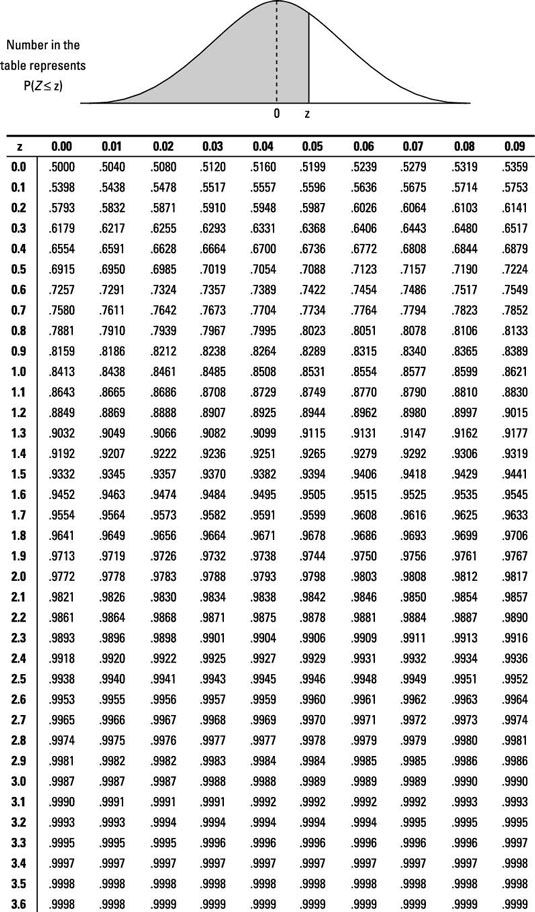
When you test a hypothesis about a population, you find a p-value and use your test statistic to decide whether to reject the null hypothesis. Mastering the process of how to find a p-value from a test statistic is vital for identifying a statistical error in our hypothesis testing.A p-value chart can be extremely useful in visually interpreting the strength of evidence against the null hypothesis in your study. To find a p-value from a test statistic, you must reference a Z-table, find your test statistic on it, and determine its corresponding probability.
The following figure shows the locations of a test statistic and their corresponding conclusions.

Note that if the alternative hypothesis is the less-than alternative, you reject H0 only if the test statistic falls in the left tail of the distribution (below –2). Similarly, if Ha is the greater-than alternative, you reject H0 only if the test statistic falls in the right tail (above 2).
To find a p-value with a test statistic:
-
Look up your test statistic on the appropriate distribution — in this case, on the standard normal (Z-) distribution in the p-value charts (called Z-tables) below.

-
Find the probability that Z is beyond (more extreme than) your test statistic:
-
If Ha contains a less-than alternative, find the probability that Z is less than your test statistic (that is, look up your test statistic on the Z-table and find its corresponding probability). This is the p-value. (Note: In this case, your test statistic is usually negative.)
-
If Ha contains a greater-than alternative, find the probability that Z is greater than your test statistic (look up your test statistic on the Z-table, find its corresponding probability, and subtract it from one). The result is your p-value. (Note: In this case, your test statistic is usually positive.)
-
If Ha contains a not-equal-to alternative, find the probability that Z is beyond your test statistic and double it. There are two cases:
If your test statistic is negative, first, find the probability that Z is less than your test statistic (look up your test statistic on the Z-table and find its corresponding probability). Then double this probability to get the p-value.
If your test statistic is positive, first find the probability that Z is greater than your test statistic (look up your test statistic on the Z-table, find its corresponding probability, and subtract it from one). Then double this result to get the p-value.
-
You might ask, "Why double the probabilities if your Ha contains a non-equal-to alternative?" Think of the not-equal-to alternative as the combination of the greater-than alternative and the less-than alternative. If you’ve got a positive test statistic, its p-value only accounts for the greater-than portion of the not-equal-to alternative; double it to account for the less-than portion. (The doubling of one p-value is possible because the Z-distribution is symmetric.)
Similarly, if you’ve got a negative test statistic, its p-value only accounts for the less-than portion of the not-equal-to alternative; double it to also account for the greater-than portion.
For example, when testing Ho: p = 0.25 versus Ha: p < 0.25, the p-value turns out to be 0.1056. This is because the test statistic was –1.25, and when you look this number up on the Z-table (in the appendix) you find a probability of 0.1056 of being less than this value. If you had been testing the two-sided alternative, Ha: p ≠ 0.25, the p-value would be 2 * 0.1056, or 0.2112.
If the results are likely to have occurred under the claim, then you fail to reject Ho (like a jury decides not guilty). If the results are unlikely to have occurred under the claim, then you reject Ho (like a jury decides guilty). The cutoff point between rejecting Ho and failing to reject Ho is another whole can of worms that I dissect in the next section (no pun intended).
Making Conclusions
After delving into the process of how to find a p-value from a test statistic and understanding its significance in hypothesis testing, we now transition to a critical stage: making conclusions.To draw conclusions about Ho (reject or fail to reject) based on a p-value, you need to set a predetermined cutoff point where only those p-values less than or equal to the cutoff will result in rejecting Ho. This cutoff point is called the alpha level (α), or significance level for the test.
While 0.05 is a very popular cutoff value for rejecting Ho, cutoff points and resulting decisions can vary — some people use stricter cutoffs, such as 0.01, requiring more evidence before rejecting Ho, and others may have less strict cutoffs, such as 0.10, requiring less evidence.
If Ho is rejected (that is, the p-value is less than or equal to the predetermined significance level), the researcher can say they've found a statistically significant result. A result is statistically significant if it’s too rare to have occurred by chance assuming Ho is true. If you get a statistically significant result, you have enough evidence to reject the claim, Ho, and conclude that something different or new is in effect (that is, Ha).
The significance level can be thought of as the highest possible p-value that would reject Ho and declare the results statistically significant. Following are the general rules for making a decision about Ho based on a p-value:
- If the p-value is less than or equal to your significance level, then it meets your requirements for having enough evidence against Ho; you reject Ho.
- If the p-value is greater than your significance level, your data failed to show evidence beyond a reasonable doubt; you fail to reject Ho.
Understanding how to get a p-value from a test statistic is essential for assessing whether the results of your test are likely to have occurred by chance, assuming the null hypothesis is true. However, this may lead you to wonder whether it’s okay to say “Accept Ho” instead of “Fail to reject Ho.” The answer is a big no.
In a hypothesis test, you are not trying to show whether or not Ho is true (which accept implies) — indeed, if you knew whether Ho was true, you wouldn’t be doing the hypothesis test in the first place. You’re trying to show whether you have enough evidence to say Ho is false, based on your data. Either you have enough evidence to say it’s false (in which case you reject Ho) or you don’t have enough evidence to say it’s false (in which case you fail to reject Ho).
Setting boundaries for rejecting Ho
Knowing how to calculate a p-value from a test statistic is a crucial step in hypothesis testing, allowing you to determine whether your results are statistically significant. These guidelines help you make a decision (reject or fail to reject Ho) based on a p-value when your significance level is 0.05:- If the p-value is less than 0.01 (very small), the results are considered highly statistically significant — reject Ho.
- If the p-value is between 0.05 and 0.01 (but not super close to 0.05), the results are considered statistically significant — reject Ho.
- If the p-value is really close to 0.05 (like 0.051 or 0.049), the results should be considered marginally significant — the decision could go either way.
- If the p-value is greater than (but not super-close to) 0.05, the results are considered non-significant — you fail to reject Ho.
When you hear a researcher say their results are found to be statistically significant, look for the p-value and make your own decision; the researcher’s predetermined significance level may be different from yours. If the p-value isn’t stated, ask for it.
Testing varicose veins
In medical studies, such as those investigating varicose veins, the skill of applying statistical analyses, including understanding how to calculate p-value in statistics, in paramount.As an example of making a decision on whether to reject an Ho, suppose there's a claim that 25 percent of all women in the U.S. have varicose veins, and the p-value was found to be 0.1056. This p-value is fairly large and indicates very weak evidence against Ho by almost anyone’s standards because it’s greater than 0.05 and even slightly greater than 0.10 (considered to be a very large significance level). In this case you fail to reject Ho.
You didn’t have enough evidence to say the proportion of women with varicose veins is less than 0.25 (your alternative hypothesis). This isn’t declared to be a statistically significant result.
But say your p-value had been something like 0.026. A reader with a personal cutoff point of 0.05 would reject Ho in this case because the p-value (of 0.026) is less than 0.05. The reader's conclusion would be that the proportion of women with varicose veins isn’t equal to 0.25; according to Ha, in this case, you conclude it’s less than 0.25, and the results are statistically significant.
However, a reader whose significance level is 0.01 wouldn’t have enough evidence (based on your sample) to reject Ho because the p-value of 0.026 is greater than 0.01. These results wouldn’t be statistically significant.
Finally, if the p-value turned out to be 0.049 and your significance level is 0.05, you can go by the book and say because it’s less than 0.05, you reject Ho, but you really should say your results are marginal, and let the reader decide.
This process, including understanding how to solve for p-value, illuminates the critical role of statistical analysis in deciphering intricate health studies and making informed decisions. The meticulous assessment of significance levels further emphasizes the value of context, demonstrating how varying criteria might lead to different interpretations.

