
You can use a hypothesis test to test a statistical claim about a population proportion when the variable is categorical (for example, gender or support/oppose) and only one population or group is being studied (for example, all registered voters).
The test looks at the proportion (p) of individuals in the population who have a certain characteristic — for example, the proportion of people who carry cellphones. The null hypothesis is H0: p = p0, where p0 is a certain claimed value of the population proportion, p. For example, if the claim is that 70% of people carry cellphones, p0 is 0.70. The alternative hypothesis is one of the following:
The formula for the test statistic for a single proportion (under certain conditions) is:
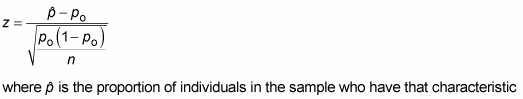
and z is a value on the Z-distribution. To calculate the test statistic, do the following:
-
Calculate the sample proportion,

by taking the number of people in the sample who have the characteristic of interest (for example, the number of people in the sample carrying cellphones) and dividing that by n, the sample size.
-
Find

where po is the value in Ho.
-
Calculate the standard error,

-
Divide your result from Step 2 by your result from Step 3.
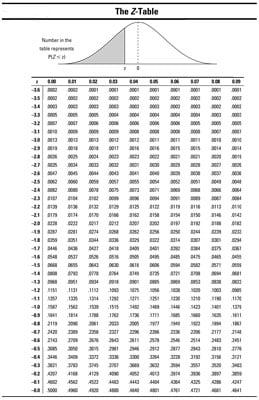
To interpret the test statistic, look up your test statistic on the standard normal (Z-) distribution and calculate the p-value.

The conditions for using this test statistic are that
For example, suppose Cavifree claims that four out of five dentists recommend Cavifree toothpaste to their patients. In this case, the population is all dentists, and p is the proportion of all dentists who recommended Cavifree. The claim is that p is equal to “four out of five,” or p0 is 4 divided by 5 = 0.80. You suspect that the proportion is actually less than 0.80. Your hypotheses are H0: p = 0.80 versus Ha: p < 0.80.
Suppose that 151 out of your sample of 200 dental patients reported receiving a recommendation for Cavifree from their dentist. To find the test statistic for these results, follow these steps:
-
Start with
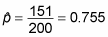
and n = 200.
-
Because po = 0.80, take p(hat)-p0=0.755 – 0.80 = –0.045 as the numerator of the test statistic.
-
Next, the standard error equals
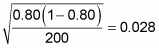
(the denominator of the test statistic).
-
The test statistic is
Because the resulting test statistic is negative, it means your sample results are –1.61 standard errors below (less than) the claimed value for the population. How often would you expect to get results like this if H0 were true? The chance of being at or beyond (in this case less than) –1.61 is 0.0537. (Keep the negative with the number and look up –1.61 in the above Z-table.) This result is your p-value because Ha is a less-than hypothesis.
Because the p-value is greater than 0.05 (albeit not by much), you don’t have quite enough evidence for rejecting H0. You conclude that the claim that 80% of dentists recommend Cavifree can’t be rejected, according to your data. However, it’s important to report the actual p-value too, so others can make their own decisions.
You might ask, “Hey, the sample proportion of 0.755 is way lower than the claimed proportion of 0.80. Why did the hypothesis test reject H0 since 0.755 is less than 0.80?” Because in this case, 0.755 is not significantly less than 0.80. You also need to factor in variation using the standard error and the normal distribution to be able to say something about the entire population of dentists.
The letter p is used two different ways in this example: p-value and p. The letter p by itself indicates the population proportion, not the p-value. Don’t get confused. Whenever you report a p-value, be sure you add –value so it’s not confused with p, the population proportion.