
When you add chart titles, Excel 2007 uses the Calibri (Body) font for the chart title (in 18-point size) and the x- and y-axis (in 10-point size). To change the font used in a title, or to change any of its attributes, select the title and then use the appropriate command buttons in the Font group on the Home tab.
Use Live Preview to see how a particular font or font size for the selected chart title looks in the chart before you select it. Simply click the Font or Font Size drop-down buttons and then highlight different font names or sizes to have the selected chart title appear in them.
If you need to change other formatting options for the titles in the chart, you can do so using the command buttons on the Format tab of the Chart Tools contextual tab.
To format the entire text box that contains the title, click one of the following buttons in the Shape Styles group:
Shape Styles thumbnail in its drop-down gallery to format both the text and text box for the selected chart title.
Shape Fill button to select a new color for the text box containing the selected chart title.
Shape Outline button to select a new color for the outline of the text box for the selected chart text.
Shape Effects button to apply a new effect (Shadow, Reflection, Glow, Soft Edges, Bevel, or 3-D Rotation) to the text box containing the selected chart title.
To format just the text in chart titles, click one of the buttons in the WordArt Styles group:
WordArt Styles to apply a new WordArt style to the text of the selected chart title.
Text Fill to select a new fill color for the text in the selected chart title from its gallery.
Text Outline to select a new outline color for the text in the selected chart title.
Text Effects to apply a text effect (Shadow, Reflection, Glow, Bevel, 3-D Rotation, or Transform) to the text of the selected chart title.
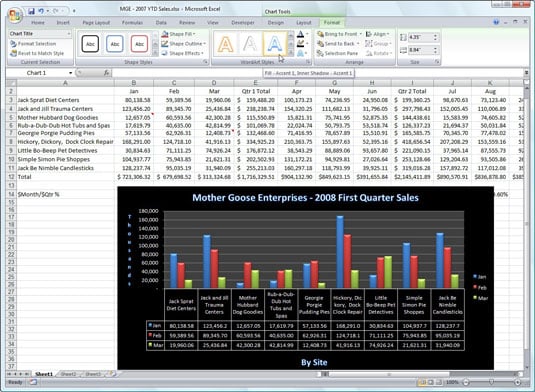 A column chart with formatted chart titles and a shape fill added to the background.