Plotting a sun chart tells you how much direct sunlight you can expect over the course of a day so you can determine whether solar power is a viable option where you live. Sun charts are easy to plot and provide a way to represent the movement of the sun across the sky. Here's how to create your own sun charts and how to use them to evaluate the amount of sunshine you can expect to receive at your home.
Chart the basic path of the sun
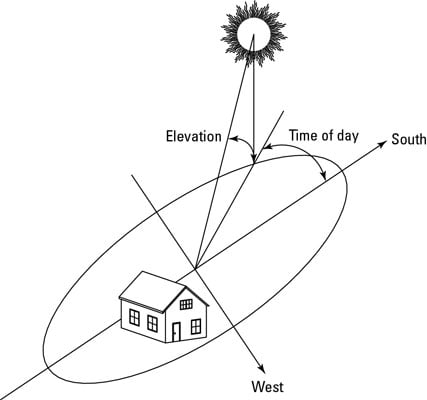
The position of the sun may be plotted with two angles: azimuth and elevation.
Azimuth is the sun's angular distance from a fixed line; in the northern hemisphere, that fixed line will probably run directly south. Theoretically, at noon, when the sun is directly overhead, the azimuth angle is 0.
Elevation is the angle created by a line parallel to the ground and a line going from the ground to the sun. If the sun is directly overhead, its elevation measurement is 90 degrees; when it sits on the horizon, the elevation is 0.
 Plot the location of the sun in the sky.
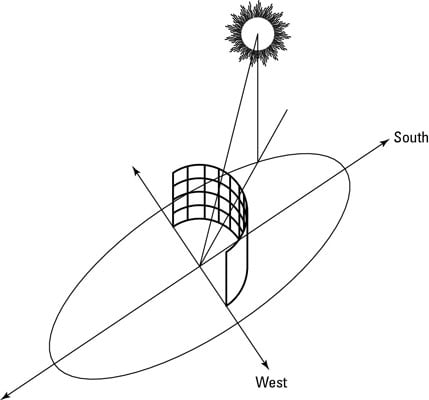
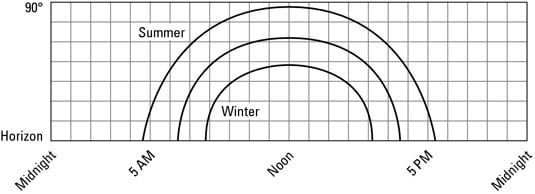
Then create a graph of the sun's passage over the course of a day. Imagine a sheet of graph paper wrapped around your house. As the day progresses, you make dots where the suns shines on the graph paper.
The following figure shows your sun chart looks like if you plot the movement of the sun. The arc in the middle represents either spring or fall. All other paths lie somewhere between the two extremes, represented by summer and winter solstice, which are the longest and shortest days of the year (June 21 and December 21, respectively).
Add skyline effects
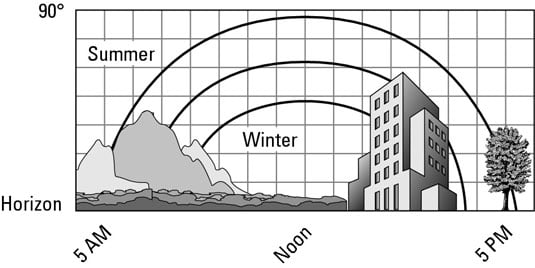
You can easily add a skyline impediments, which include horizon, buildings, trees, towers, and so on to your sun charts.
When the sun goes behind a mountain or a tall building, you don't get any direct sunlight at all. If the sun goes behind a tree, you may get some direct sunlight, but mostly you get shading. Impediments on the horizon also change the time of dawn and dusk. If a big mountain lies directly west of your house, dusk falls a lot earlier.
You can either buy (very expensive, and you only need it once) or rent ($25 per week) a Solar Pathfinder, which works as follows: You stand at the site you want to measure, aim the device south (it has a compass), level it (it has a bubble level), and then read the shade reflections on a domed indicator.
Note sunlight intensity
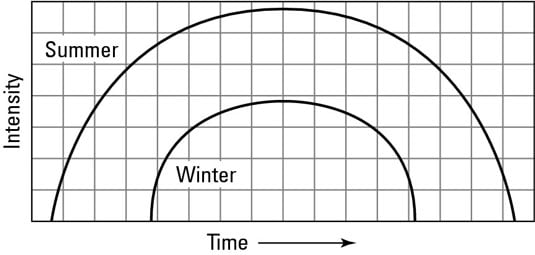
When the sun is lower in the sky, solar radiation must pass through more atmosphere, and it's therefore reduced by scattering and absorption.
The sun is the most intense when it's directly overhead. And summer sunlight is much stronger than winter.
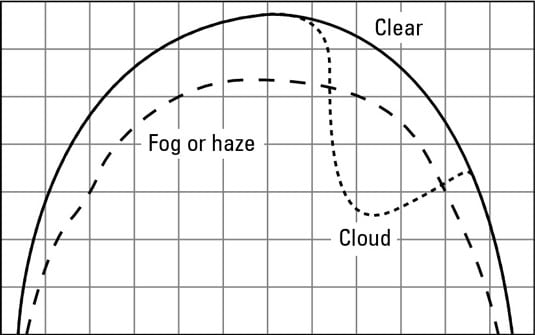
Sunlight likewise changes along with the weather. If your climate is often foggy or hazy in the morning, the charts show a very shallow curve on the left-hand side, and then when the fog burns off, the chart goes back up to normal.