
The table and graph problems on the GRE Math test may include arithmetic mean, standard deviation, and data analysis. If you're fresh out of math class, you'll probably be fine going through these quickly.
If it's been a few years since you've dealt with statistics and data-related problems, you may want to work these questions carefully. Shortfalls in math are in three basic categories. See whether you're prone to one of these in particular:
Mistakes in basic math, such as not placing the decimal point correctly
Mistakes in working the problem, such as multiplying fractions when you should be adding them
Not knowing how to work a certain math problem, such as calculating mean or median
The following practice questions will test your skills at finding the median of a set of numbers and interpreting data in a temperature graph.
Practice questions
A survey asked drivers how many accidents they have had over the past five years. The table shows the survey results.
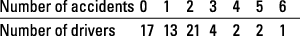
What is the median number of accidents per driver?
A. 0.5
B. 1
C. 1.5
D. 2
E. 4
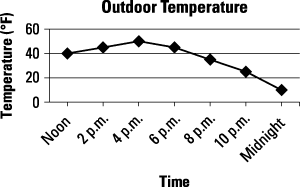
Study the following line graph showing the outdoor temperature throughout the day.
Which of the following can be correctly deduced from the data in the table? (Select all the correct answers.)
A. The temperature is about 30°F at 9 p.m.
B. The range of temperatures is 40°F.
C. The average temperature during this time frame is 25°F.
D. There is a 40% decrease in temperature between 6 p.m. and 8 p.m.
Answers and explanations
C. 1.5
The median is the middle number when ranked in numerical order. There are 60 drivers, so the median will come between the value for the 30th and 31st drivers.
There are two middle numbers: 1 and 2. Add these numbers together and divide by 2:
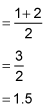
The median is 1.5, Choice (C).
A. The temperature is about 30 degrees Fahrenheit at 9 p.m.; B. The range of temperatures is 40 degrees Fahrenheit.
Choice (A) is correct — the recorded temperature at 8 p.m. is 35 degrees Fahrenheit, and the recorded temperature at 10 p.m. is 25 degrees Fahrenheit. The temperature is dropping at a regular rate; therefore, at 9 p.m. the temperature is about 30 degrees Fahrenheit.
Choice (B) is also correct — the highest temperature recorded is 50 degrees Fahrenheit at 4 p.m., and the lowest temperature recorded is 10 degrees Fahrenheit at midnight. The difference between the highest and the lowest temperatures is:

Choice (C) is incorrect — without actually calculating the average, it is clearly higher than 25 degrees Fahrenheit.
Choice (D) is also incorrect — without actually calculating the percent of change, the drop from 45 degrees Fahrenheit to 35 degrees Fahrenheit is far less than 60%.