Color is most often used to separate the various sections of an Excel table. The basic idea is that the colors applied to a table suggest the relationship between the rows and columns. The problem is that colors often distract and draw attention away from the important data. In addition, printed tables with dark-colored cells are notoriously difficult to read (especially on black-and-white printers).
They are also hard on the toner budget, if that holds any importance to you.
Colors in general should be used sparingly, reserved for providing information about key data points. The headers, labels, and natural structure of your table are more than enough to guide your audience. There is no real need to add a layer of color as demarcation for your rows and columns.
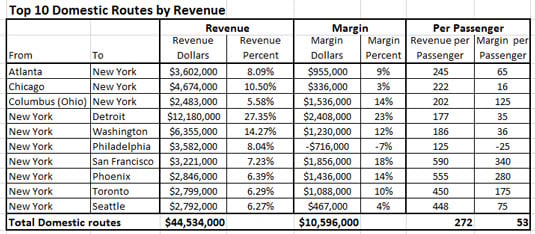
This figure shows a table with the colors removed from the various columns. As you can see, it's easy to read.
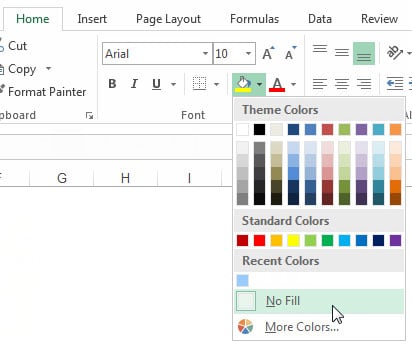
If you're working with a table that contains colored cells, you can quickly remove the color by highlighting the cells and choosing the No Fill option under the Theme Colors drop-down menu on the Home tab.