The FREQUENCY function in Excel counts the values in an array that fall within a range, or bin. The function uses the following syntax:
=FREQUENCY(data_array,bins_array)
where data_array is the worksheet range that holds the values that you want to count and bins_array is a worksheet range that identifies the ranges of values, or bins, that you want to use to create a frequency distribution. Take a look at the following figure, for example.
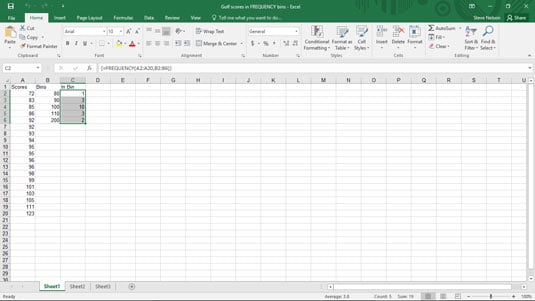
To categorize the values in the worksheet range A2:A20 using the bins shown in B2:B6, select the worksheet range C2:C6 and enter the formula
=FREQUENCY(A2:A20,B2:B6)
Then press Ctrl+Shift+Enter to tell Excel that the function formula should be entered as an array. Excel enters your formula into each of the cells in the worksheet range C2:C6, with the result shown.
In cell C2, the function uses the bin value in cell B2 to count up all the data values greater than 0 and less than or equal to 80. In cell C3, the function counts up all the data values greater than 80 but less than 90, and so on. Note that you need to arrange your bin range values in ascending order.