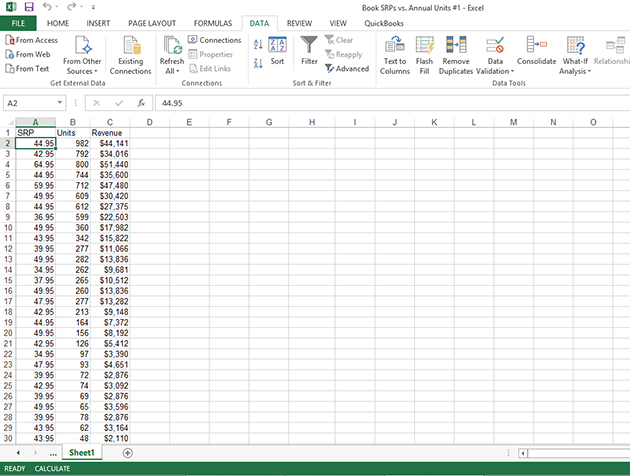
In column A, the worksheet shows the suggested retail price (SRP). In column B, the worksheet shows the units sold of each book through one popular bookselling outlet. You might choose to use the Descriptive Statistics tool to summarize this data set.
To calculate descriptive statistics for the data set, follow these steps:
-
Click the Data tab’s Data Analysis command button to tell Excel that you want to calculate descriptive statistics.
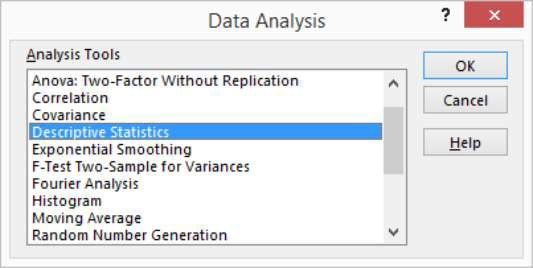
Excel displays the Data Analysis dialog box.
-
In the Data Analysis dialog box, highlight the Descriptive Statistics entry in the Analysis Tools list and then click OK.
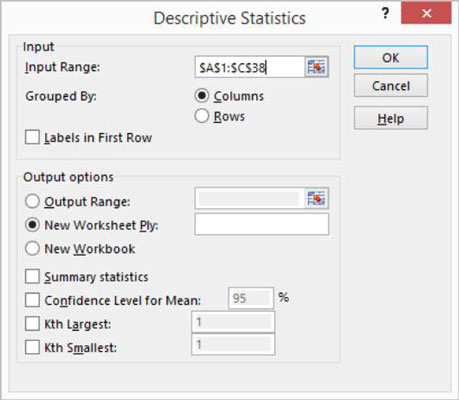
Excel displays the Descriptive Statistics dialog box.
-
In the Input section of the Descriptive Statistics dialog box, identify the data that you want to describe.
-
To identify the data that you want to describe statistically: Click the Input Range text box and then enter the worksheet range reference for the data. In the case of the example worksheet, the input range is $A$1:$C$38. Note that Excel wants the range address to use absolute references — hence, the dollar signs.
To make it easier to see or select the worksheet range, click the worksheet button at the right end of the Input Range text box. When Excel hides the Descriptive Statistics dialog box, select the range that you want by dragging the mouse. Then click the worksheet button again to redisplay the Descriptive Statistics dialog box.
-
To identify whether the data is arranged in columns or rows: Select either the Columns or the Rows radio button.
-
To indicate whether the first row holds labels that describe the data: Select the Labels in First Row check box. In the case of the example worksheet, the data is arranged in columns, and the first row does hold labels, so you select the Columns radio button and the Labels in First Row check box.
-
-
In the Output Options area of the Descriptive Statistics dialog box, describe where and how Excel should produce the statistics.
-
To indicate where the descriptive statistics that Excel calculates should be placed: Choose from the three radio buttons here — Output Range, New Worksheet Ply, and New Workbook. Typically, you place the statistics onto a new worksheet in the existing workbook. To do this, simply select the New Worksheet Ply radio button.
-
To identify what statistical measures you want calculated: Use the Output Options check boxes. Select the Summary Statistics check box to tell Excel to calculate statistical measures such as mean, mode, and standard deviation. Select the Confidence Level for Mean check box to specify that you want a confidence level calculated for the sample mean.
Note: If you calculate a confidence level for the sample mean, you need to enter the confidence level percentage into the text box provided. Use the Kth Largest and Kth Smallest check boxes to indicate you want to find the largest or smallest value in the data set.
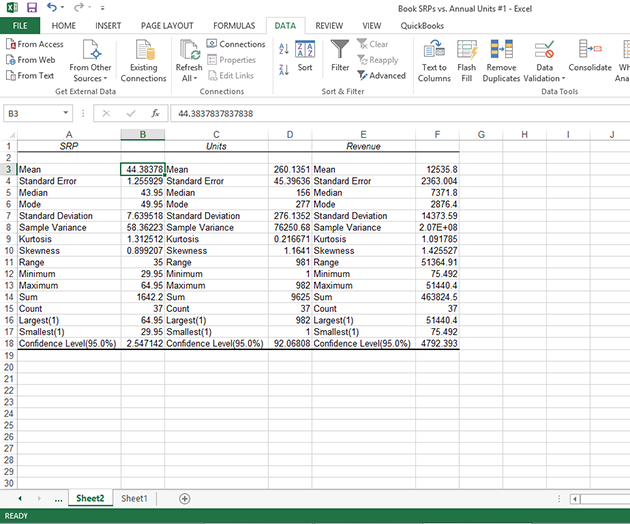
After you describe where the data is and how the statistics should be calculated, click OK. Here are the statistics that Excel calculates.
Statistic Description Mean Shows the arithmetic mean of the sample data. Standard Error Shows the standard error of the data set (a measure of the difference between the predicted value and the actual value). Median Shows the middle value in the data set (the value that separates the largest half of the values from the smallest half of the values). Mode Shows the most common value in the data set. Standard Deviation Shows the sample standard deviation measure for the data set. Sample Variance Shows the sample variance for the data set (the squared standard deviation). Kurtosis Shows the kurtosis of the distribution. Skewness Shows the skewness of the data set’s distribution. Range Shows the difference between the largest and smallest values in the data set. Minimum Shows the smallest value in the data set. Maximum Shows the largest value in the data set. Sum Adds all the values in the data set together to calculate the sum. Count Counts the number of values in a data set. Largest(X) Shows the largest X value in the data set. Smallest(X) Shows the smallest X value in the data set. Confidence Level(X) Percentage Shows the confidence level at a given percentage for the data set values.
-