
Some statistical measures in Excel can be very confusing, but chi-square functions really are practical. Even if you’re going to use only one of the chi-square functions, read through all three function descriptions. Viewed as a set of statistical tools, the functions make quite a bit more sense.
CHISQ.DIST.RT: Chi-square distribution
The CHISQ.DIST.RT function, which calculates the right-tailed probability of a chi-squared distribution, calculates a level of significance using the chi-square value and the degrees of freedom. The chi-square value equals the sum of the squared standardized scores. The function uses the syntax
=CHISQ.DIST.RT(<i>x</i>,<i>deg_freedom</i>)
where x equals the chi-square value and deg_freedom equals the degrees of freedom.
As an example of how all this works, suppose you’re more than a little suspicious of some slot machine that shows one of six pictures: diamonds, stars, cowboy boots, cherries, oranges, or pots of gold. With six possibilities, you might expect that in a large sample, each of the six possibilities would appear roughly one-sixth of the time.
Say the sample size is 180, for example. In this case, you might expect that each slot machine possibility appears 30 times because 180/6 equals 30. If you built a worksheet fragment like this one, you could analyze the one-armed bandit.
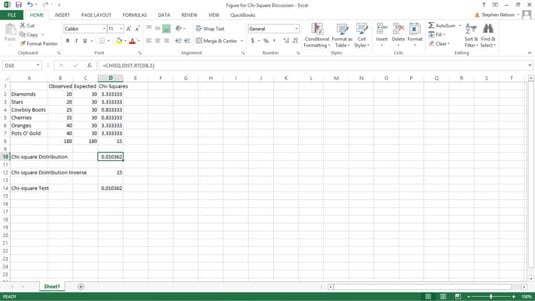
To calculate the level of significance and the chi-square distribution function, you could enter the following formula into D10:
=CHISQ.DIST.RT(D8,5)
The function returns the value 0.010362338, which is the level of significance that a chi-square value of 15 is due to sampling error.
Cell D8 holds the chi-square value, which is simply the sum of the squared differences between the observed and expected values. For example, the value in cell D2 is calculated using the formula =+(B2–C2)^2/C2 to return the value 3.333333333. Predictably, similar formulas in the range D3:D7 calculate the squared differences for the other slot machine symbols. And, oh, by the way, the formula in cell D8 is =SUM(D2:D7).
The bottom line: It doesn’t look good, does it? There’s only a 1-percent chance that the slot machine that you’re worried about could actually produce the observed values due to chance. Very suspicious.
CHISQ.DIST: Chi-square distribution
The CHISQ.DIST function resembles the CHISQ.DIST.RT function but calculates the left-tailed probability of a chi-squared distribution. The function uses the syntax
=CHISQ.DIST(x,deg_freedom,cumulative)
where x equals the chi-square value, deg_freedom equals the degrees of freedom, and cumulative is a switch you set to 0 or FALSE if you want to calculate a probability density and to 1 or TRUE if you want to calculate a cumulative probability.
CHISQ.INV.RT: Right-tailed chi-square distribution probability
The CHISQ.INV.RT function returns the inverse of the right-tailed probability of a chi-square distribution. The function uses the syntax
=CHISQ.INV.RT(probability,deg_freedom)
where probability equals the level of significance and deg_freedom equals the degrees of freedom.
To show you an example of the CHISQ.INV.RT function, refer to the worksheet fragment. With six possible outcomes on the slot machine, you have five degrees of freedom. Therefore, if you want to calculate the chi-square that’s equivalent to a 0.010362338 level of significance, you could enter the following formula into cell D12:
=CHISQ.INV.RT(D10,5)
This function returns the value 14.99996888, which is pretty darn close to 15. Note that D10 is used as the first probability argument because that cell holds the level of significance calculated by the CHISQ.DIST function.
CHISQ.INV: Left-tailed chi-square distribution probability
The CHISQ.INV function returns left-tailed probability of a chi-square distribution. The function uses the syntax
=CHISQ.INV(probability,deg_freedom)
where probability equals the level of significance and deg_freedom equals the degrees of freedom.
To calculate the chi-square value that’s equivalent to a 0.010362338 level of significance with 5 degrees of freedom, you could enter the following formula into a cell in the worksheet:
=CHISQ.INV(0.010362338,5)
This function returns the value .562927.
CHISQ.TEST: Chi-square test
The chi-square test function lets you assess whether differences between the observed and expected values represent chance, or sampling error. The function uses the syntax
=CHISQ.TEST(actual_range,expected_range)
Again referring to the example of the suspicious slot machine, you could perform a chi-square test by entering the following formula into cell D14 and then comparing what you observe with what you expect:
=CHISQ.TEST(B2:B7,C2:C7)
The function returns the p-value, or probability, shown in cell D14, indicating that only a 1.0362-percent chance exists that the differences between the observed and expected outcomes stem from sampling error.
A common feature of a chi-square test is comparison of the p-value — again the value that the CHISQ.TEST function returns — to a level of significance. For example, in the case of the suspicious slot machine, you might say, “Because it’s not possible to be 100-percent sure, we’ll say that we want a 95-percent probability, which corresponds to a 5-percent level of significance.”
If the p-value is less than the level of significance, you assume that something is fishy. Statisticians, not wanting to sound so earthy, have another phrase for this something-is-fishy conclusion: rejecting the null hypothesis.