
After going through extensive editing and formatting of one of Excel’s basic chart types, you may want to save your work of art as a custom chart type that you can then use again with different data without having to go through all the painstaking steps to get the chart looking just the way you want it.
Excel makes it easy to save any modified chart that you want to use again as a custom chart type.
To convert a chart on which you’ve done extensive editing and formatting into a custom chart type, you take these steps:
Right-click the customized chart in the worksheet or on its chart sheet to select its chart area and display its shortcut menu.
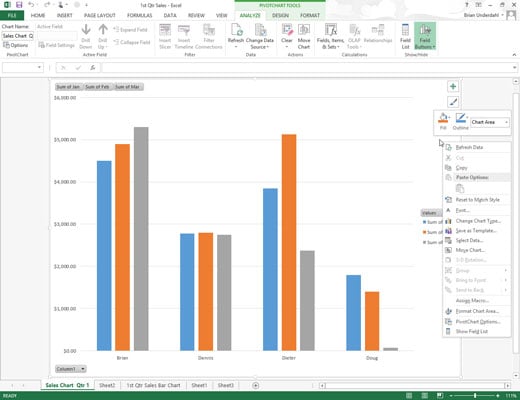
You can tell that the chart area (as opposed to any specific element in the chart) is selected because the Format Chart Area option appears near the bottom of the displayed shortcut menu.
Choose the Save As Template option from the shortcut menu.
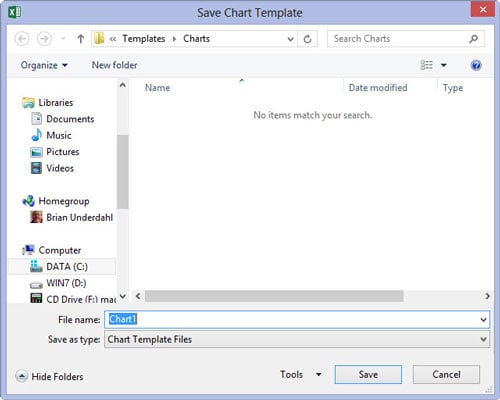
Excel opens the Save Chart Template dialog box. The program automatically suggests Chart1.crtx as the filename, Chart Template Files (*.crtx) as the file type, and the Charts folder in the Microsoft Templates folder as the location.
Edit the generic chart template filename in the File Name text box to give the chart template file a descriptive name without removing the .crtx filename extension.
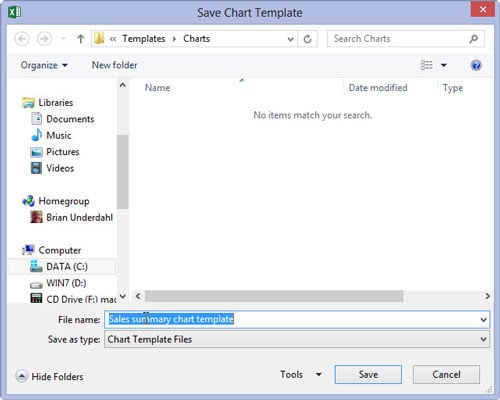
Click the Save button to close the Save Chart Template dialog box.
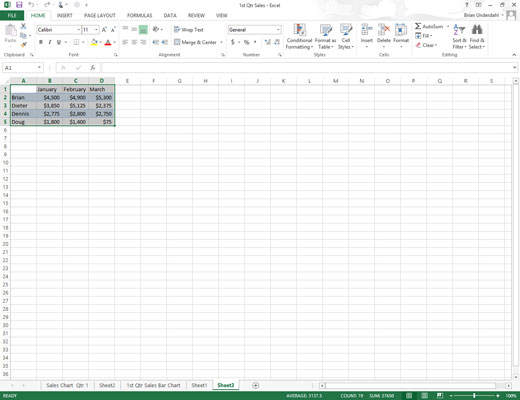
Use the template to create a new chart. Select the data in the worksheet to be graphed in a new chart using your chart template.
You can then use the template anytime you need to create a new chart that requires similar formatting.
Click the Dialog Box launcher in the lower-right corner of the Charts group on the Insert tab of the Ribbon.
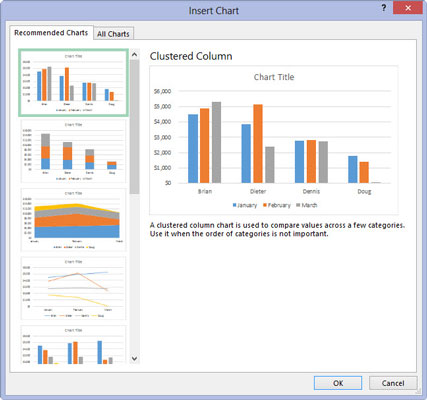
The Insert Chart dialog box appears with the Recommended Charts tab selected.
Click the All Charts tab and then select the Templates option in the Navigation pane of the Insert Chart dialog box.
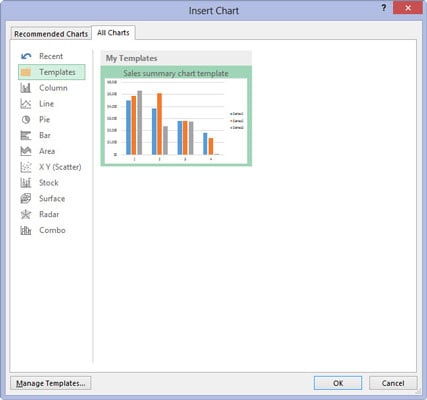
Excel then displays thumbnails for all the chart templates you’ve saved in the main section of the Create Chart dialog box. To identify these thumbnails by filename, position the mouse pointer over the thumbnail image.
Click the thumbnail for the chart template you want to use to select it and then click OK.
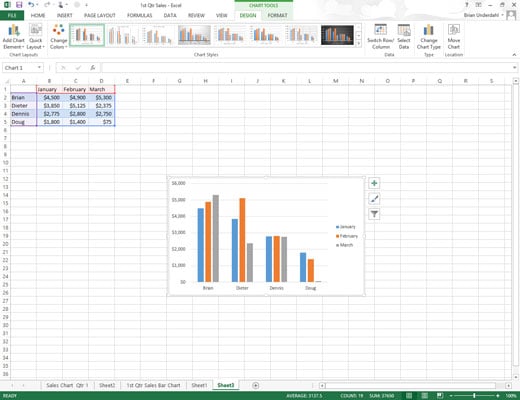
As soon as you click OK, Excel applies the layout and all the formatting saved as part of the template file to the new embedded chart created with the data in the current cell selection.