
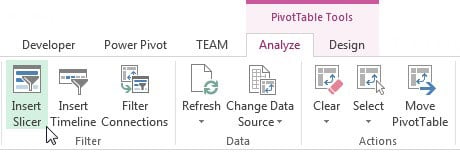
Place the cursor anywhere inside the pivot table, and then go up to the Ribbon and click the Analyze tab. There, click the Insert Slicer icon.
This step opens the Insert Slicers dialog box.
Select the dimensions you want to filter.
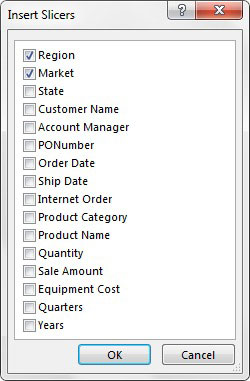
In this example, the Region and Market slicers are created.
After the slicers are created, simply click the filter values to filter the pivot table.
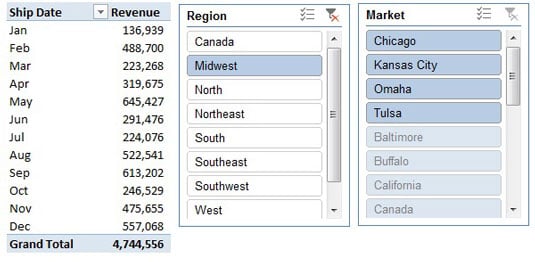
As you can see, clicking Midwest in the Region slicer not only filters the pivot table, but the Market slicer also responds by highlighting the markets that belong to the Midwest region.
You can also select multiple values by holding down the Ctrl key on the keyboard while selecting the needed filters.
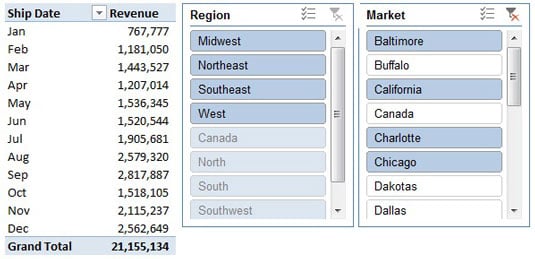
The fact that you can see the current filter state gives slicers a unique advantage over Filter fields.
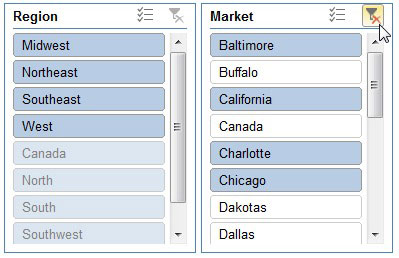
Here, holding down the Ctrl key while selecting Baltimore, California, Charlotte, and Chicago highlights not only the selected markets in the Market slicer but also their associated regions in the Region slicer.
Click the Clear Filter icon on the target slicer.
This clears the filters on a slicer.