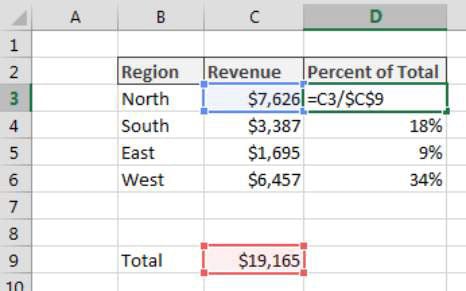
Percent distribution is a measure of how a metric (such as total revenue) is distributed among the component parts that make up the total. As you can see, the calculation is relatively simple. You divide each component part by the total. This example has a cell that contains Total revenue (cell C9). You then divide each region’s revenue by the total to get a percent distribution for each region.
How it works
This formula doesn’t have a lot to it. You’re simply using cell references to divide each component value by the total. The one thing to note is that the cell reference to the Total is entered as an absolute reference ($C$9). Using the dollar symbols locks the reference in place, ensuring that the cell reference pointing to Total does not adjust as you copy the formula down.
Alternative: Percent distribution without a dedicated Total cell
You don’t have to dedicate a separate cell to an actual Total value. You can simply calculate Total on the fly within the percent distribution formula. The figure demonstrates how you can use the SUM function in place of a cell dedicated to holding a Total. The SUM function adds together any numbers you pass to it.
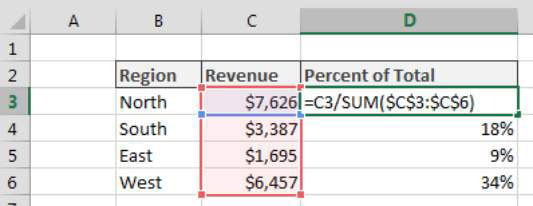
Again, note the use of absolute references in the SUM function. Using absolute references ensures that the SUM range stays locked as you copy the formula down:
=C3/SUM($C$3:$C$6)