The Report Wizard requires a few more decisions from you than the Report tool, but it's more flexible than the instant Report tool. Here it goes:
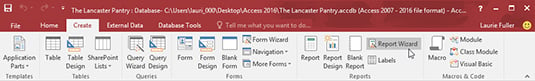
In your database window, click the Ribbon's Create tab and then click the Report Wizard button. (It's right there in the tab's Reports section.)
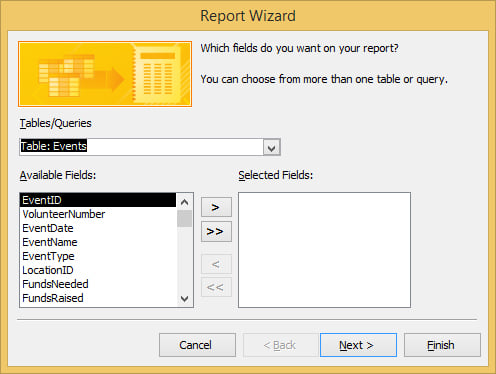
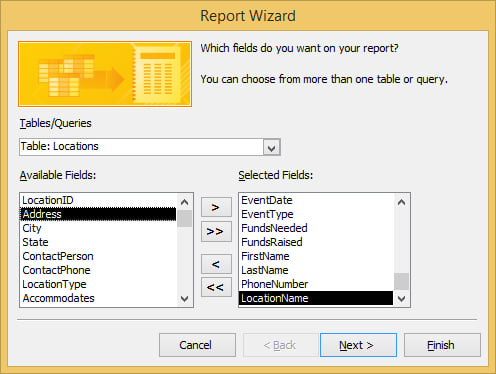
The Report Wizard dialog box appears, listing all the fields in the active table. You'll also find a drop-down list from which you can choose other tables and queries and two columns of Selected and Available fields, which you use to determine which fields from the selected table(s) will be used in your report.
Use the Tables/Queries drop-down list to choose the table you want to start with.
The fields from the table you select appear in the Available Fields box.
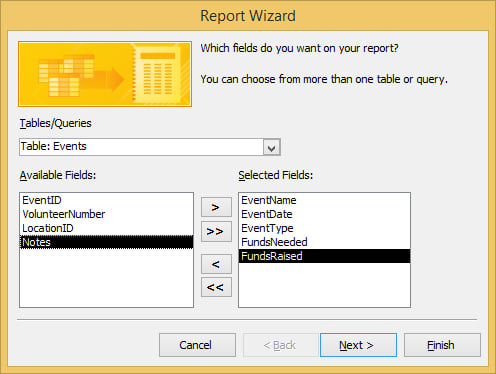
Add fields to your report by double-clicking them in the Available Fields box.
By double-clicking, you add the fields to the Selected Fields box, and they become part of the report. You can also click a field once and then click the button with a > symbol on it.
Repeat Steps 2 and 3 for each table and/or query in the database that you want to include in the report. Click Next to move on to the next page of the Report Wizard; then click Next again.
If, at any point, you want to add all the fields in a given table or query, just click the >> button to add all the Available Fields to the Selected Fields list.
Clicking Next twice bypasses grouping questions, which, for a simple report, are often unnecessary.
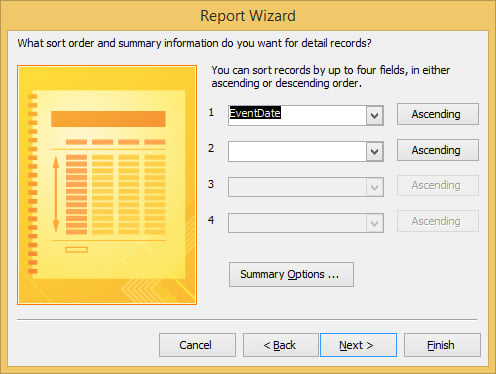
Choose a sort order for your report — typically sorting on the field that folks will use to look up information in the report. Click Next.
For example, if your report documents a list of employees, Last Name might be a good choice. A report on product sales would be useful in Product Number or Product Name order. You can sort by more than one field, choosing up to four fields to sort by and either Ascending or Descending for the sort order on each field.
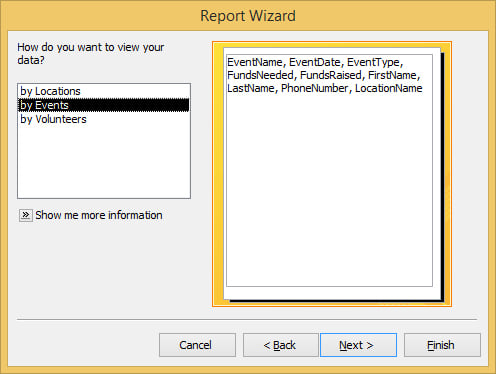
Next, if you've chosen fields from more than one table, you're asked to choose how you want to view them.
This essentially indicates which table is the dominant or main table for the report. In the case of the demo here, choose Events, which is the default because it's the table from which you selected the first report fields.
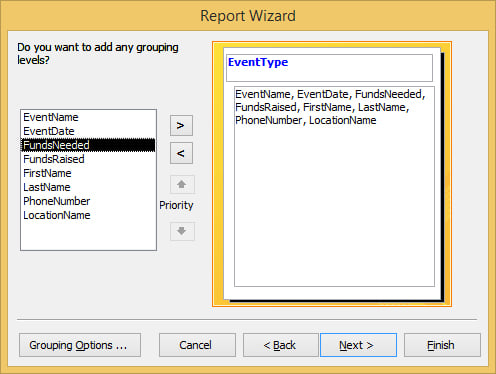
Another step that appears if you've included fields from more than one table is shown below.
In this step, you choose how you'll group your report's records. EventType is chosen here, so that all the Collection events are together, then Education, then Fundraising, in that order. To apply the grouping, click the field name in the box on the left, and then click the right-pointing arrow. This places the selected field in blue, above the rest of the fields included in the report.
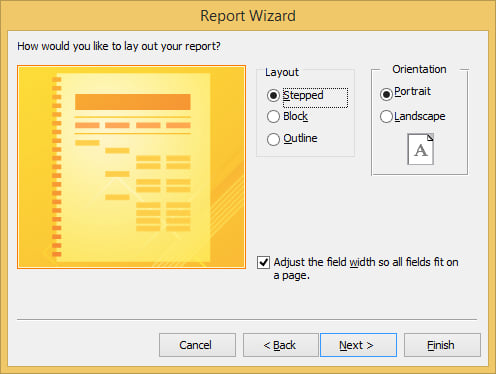
Choose a Layout and an Orientation from the two sets of radio buttons and click Next.
Layout options (Tabular or Columnar) are simple — you either want to see your report as a list (Tabular) or in sections (Columnar), in which each record appears in a section on its own. Justified is similar to Tabular, but groups the fields in a sort of stacked jumble.
Orientation decisions (Portrait or Landscape) are generally easier if you envision the report in your head — are there more fields than will fit across a sheet of 8.5-inch-wide paper? If so, choose Landscape to give yourself 11 inches of paper (or 10 inches, to allow for the smallest margin possible) across which your fields will appear.
Click Next.
A default name for your report now appears in this next step in the wizard.
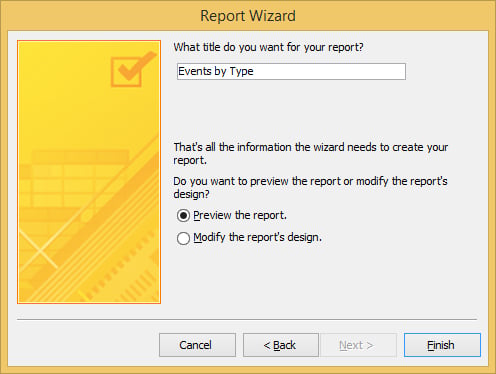
Give your report a name.
Type a name in the long box at the top of the dialog box. At this point, you also need to decide how to finish things up — with a Preview of the report, or by leaping right into Design view to make more changes to your report's appearance and content. For now, choose to Preview the Report, which is the default.
When you click Finish, the report appears in a Preview window, at which point you can print it or save it for future use. (Press Ctrl+S, or click the Save button and give the report a name, when prompted, to take care of the saving business.)
After you've saved it — or if you have no need to save it or continue viewing it — you can close it by right-clicking the report's tab and choosing Close from the pop-up menu. If you make additional changes and haven't chosen to save, you'll be asked if you want to close without saving.
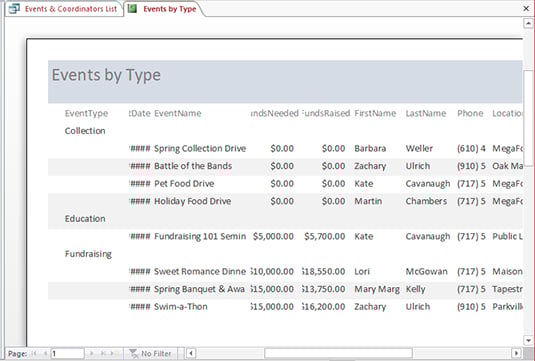
Of course, you'll probably want to make changes to the report, such as changing column widths where information is being cut off, such as field names (see the FundsNeeded and FundsRaised labels) and their data (see the EventDate label and data), as shown below. This is done in either Design or Layout view, and to switch to either view, right-click the report's tab and choose the view you want to work in from the popup.