iris data frame. Here, you learn how to create an SVM that identifies the party affiliations of members of the 1984 U.S. House of Representatives. The target variable is whether the congressperson is a Republican or a Democrat, based on their votes on 16 issues of that time. The issues range from water-project cost sharing to education spending.Nine votes are possible, but they are aggregated into the three classes y (yea), n (nay), or ? (vote not registered). (Usually, a question mark (?) signifies missing data, but not in this case.)
Here are a couple of cautions to bear in mind:
- The name of each issue does not provide enough information to understand the entirety of the issue. Sometimes the associated bill has such convoluted wording that it’s hard to tell what a y or n vote means.
- Nothing here is intended as an endorsement or a disparagement of any position or of either party. This is just a machine learning exercise.
Congressional Voting Records data set in the UCI ML repository.From this page, navigate to the Data Folder and then to the data. Press Ctrl+A to highlight all the data, and then press Ctrl+C to copy it all to the clipboard. Then this code
house <- read.csv("clipboard",header=FALSE)
turns the data into a data frame. At this point, the first six rows of the data frame are
> head(house)
          V1 V2 V3 V4 V5 V6 V7 V8 V9 V10 V11 V12 V13 V14 V15 V16 V17
1 republican  n  y  n  y  y  y  n  n   n   y   ?   y   y   y   n   y
2 republican  n  y  n  y  y  y  n  n   n   n   n   y   y   y   n   ?
3   democrat  ?  y  y  ?  y  y  n  n   n   n   y   n   y   y   n   n
4   democrat  n  y  y  n  ?  y  n  n   n   n   y   n   y   n   n   y
5   democrat  y  y  y  n  y  y  n  n   n   n   y   ?   y   y   y   y
6   democrat  n  y  y  n  y  y  n  n   n   n   n   n   y   y   y   y
A look at the variable names (in the data set description) shows that most of them are pretty long (like anti-satellite-test-ban). Typing them takes a lot of time, and assigning them short abbreviations might not be much more informative than V15 or V16. So just change V1 to Party:colnames(house)[1] = "Party"
You can use the kernlab package to create the SVM. More specifically, you can use the rattle package, which provides a GUI to kernlab.
Reading in the data
With therattle package installed,rattle()
opens the Data tab. To read in the data, follow these steps:
- Click the R Dataset radio button to open the Data Name box.
- Click that box’s down arrow and select House from the menu that appears.
- Click to select the check box next to Partition, and then click the Execute button in the upper left corner of the window.
- Click the Target radio button for Party and the Input radio button for V17, and then click the Execute icon again.
Rattle Data tab should now look like this.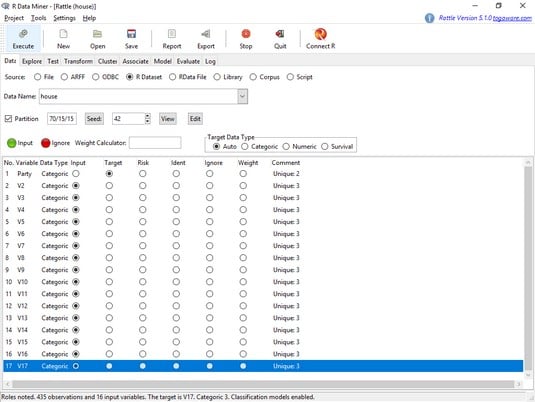 The rattle Data tab, after selecting and modifying the house data frame.
Exploring the data
Next, you’ll want to explore the data. The first thing to look at is a distribution of party affiliation. Here’s how:- On the Explore tab, click the Distributions radio button and the check box next to Party.
- In the Group By box, select blank (the first choice) so that this box is empty.
This image shows what the Explore tab looks like after all this takes place.
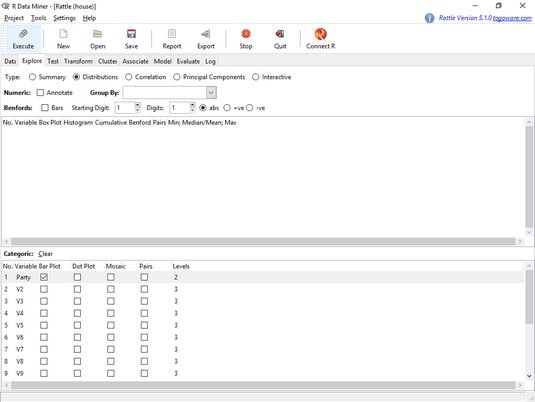 The rattle Explore tab, set up to plot a distribution of party affiliation.
 - Click Execute.
That last step produces what you see below, which shows the distribution of Republicans and Democrats in the data frame.
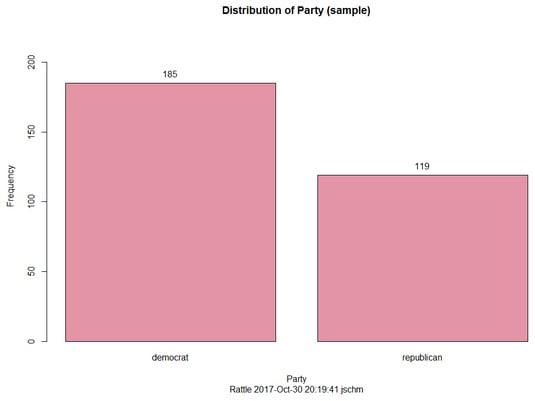 The distribution of Republicans and Democrats in the house data frame.
Creating the SVM
On to the SVM. Follow these steps:- On the Model tab, click the SVM radio button.
- In the Kernel box, click the down arrow and then select Linear (vanilladot) from the menu that appears.
This image shows the Explore tab after these choices are made.
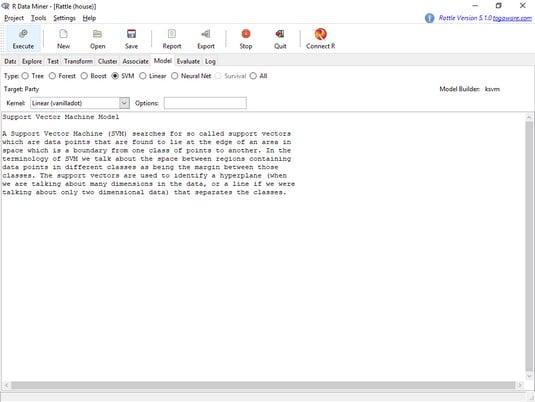 The rattle Model tab, set up to create an SVM for the house data frame.
 - Click the Execute icon.
Clicking Execute changes the screen to look like what you see below, showing the results of the SVM. The machine found 34 support vectors and produced a Training error of .016447.
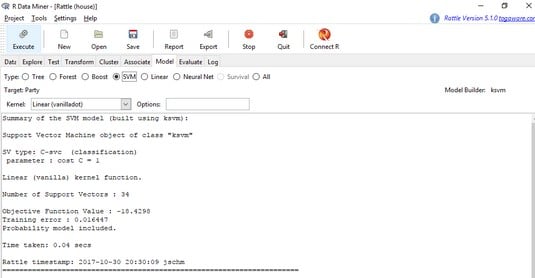 The results of the SVM for the house data frame.
Evaluating the SVM
To evaluate the SVM against the Testing set, complete these steps:- Click to select the Evaluate tab.
- For Type, click the Error Matrix radio button.
- For Data, click the Testing radio button.
- Click Execute to produce the screen shown below.
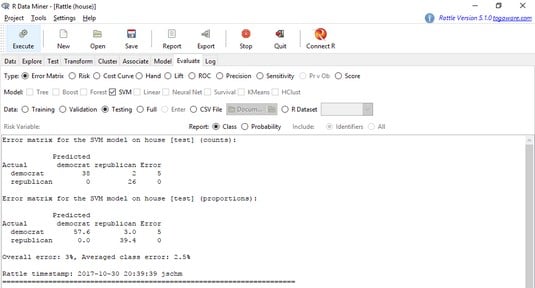 Evaluating the SVM against the Testing set.