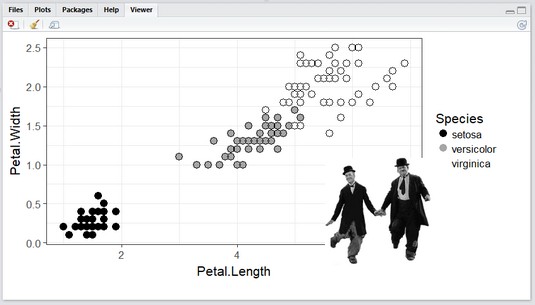
This image shows the end product — the plot of the iris data set with comedy icons Laurel and Hardy positioned in front of the plot legend. When you open this combined image in the Viewer, you see Stan and Ollie dancing their little derbies off. (The derbies don’t actually come off in the animation, but you get the drift.)
 Laurel and Hardy, dancing in front of the legend in the
 iris plot.Getting Stan and Ollie
Check out the Laurel and Hardy GIF. Right-click the image and select Save Image As from the pop-up menu that appears. Save it asanimated-dancing-image-0243 in your Documents folder.Then read it into R:
l_and_h <- image_read("animated-dancing-image-0243.gif")
Applying the length() function to l_and_h
> length(l_and_h)
[1] 10
indicates that this GIF consists of ten frames.
To add a coolness factor, make the background of the GIF transparent before image_read() works with it. This free online image editor does the job quite nicely.
Combining the boys with the background
If you use the image combination technique, the code looks like this:image_composite(image=background, composite_image=l_and_h, offset = "+510+200")
The picture it produces looks like the image above but with one problem: The boys aren’t dancing. Why is that?
The reason is that image_composite() combined the background with just the first frame of l_and_h, not with all ten. It’s exactly the same as if you had run
image_composite(image=background, composite_image=l_and_h[1],
                offset = "+510+200")
The length() function verifies this:
> length(image_composite(image=background, composite_image=l_and_h,
         offset = "+510+200"))
[1] 1
If all ten frames were involved, the length() function would have returned 10.To get this done properly, you have to use a magick function called image_apply().
Explaining image_apply()
So that you fully understand how this important function works, let's describe an analogous function calledlapply().If you want to apply a function (like mean()) to the variables of a data frame, like iris, one way to do that is with a for loop: Start with the first column and calculate its mean, go to the next column and calculate its mean, and so on until you calculate all the column means.
For technical reasons, it’s faster and more efficient to use lapply() to apply mean() to all the variables:
> lapply(iris, mean) $Sepal.Length [1] 5.843333A warning message comes with that last one, but that’s okay.$Sepal.Width [1] 3.057333
$Petal.Length [1] 3.758
$Petal.Width [1] 1.199333
$Species [1] NA
Another way to write lapply(iris, mean) is lapply(iris, function(x){mean(x)}).
This second way comes in handy when the function becomes more complicated. If, for some reason, you want to square the value of each score in the data set and then multiply the result by three, and then calculate the mean of each column, here’s how to code it:
lapply(iris, function(x){mean(3*(x^2))})
In a similar way, image_apply() applies a function to every frame in an animated GIF. In this project, the function that gets applied to every frame is image_composite():
function(frame){image_composite(image=background, composite_image=frame, offset = "+510+200")}
So, within image_apply(), that’s
frames <- image_apply(image=l_and_h, function(frame) {
  image_composite(image=background, composite_image=frame, offset = "+510+200")
})
After you run that code, length(frames) verifies the ten frames:> length(frames)
[1] 10
Getting back to the animation
Theimage_animate() function puts it all in motion at ten frames per second:animation <- image_animate(frames, fps = 10)
To put the show on the screen, it’s
print(animation)
All together now:
l_and_h <- image_read("animated-dancing-image-0243.gif")
background <- image_background(iris_plot, "white)frames <- image_apply(image=l_and_h, function(frame) {
image_composite(image=background, composite_image=frame, offset = "+510+200")
})
animation <- image_animate(frames, fps = 10)
print(animation)
And that’s the code for the image above.One more thing. The image_write() function saves the animation as a handy little reusable GIF:
image_write(animation, "LHirises.gif")