
- Create a large number of decision trees, each one different from the other, based on different subsets of observations and variables.
- Bootstrap the dataset of observations for each tree (sampled from the original data with replacement). The same observation can appear multiple times in the same dataset.
- Randomly select and use only a part of the variables for each tree.
- Estimate the performance for each tree using the observations excluded by sampling (the Out Of Bag, or OOB, estimate).
- Obtain the final prediction, which is the average for regression estimates or the most frequent class for prediction, after all the trees have been fitted and used for prediction.
Leo Breiman derived the idea for Random Forest from the bagging technique. Scikit-learn has a bagging class for both regression (BaggingRegressor) and classifying (BaggingClassifier) that you can use with any other predictor you prefer to pick from Scikit-learn modules. The max_samples and max_features parameters let you decide the proportion of cases and variables to sample (not bootstrapped, but sampled, so you can use a case only once) for building each model of the ensemble. The n_estimators parameter decides the total number of models in the ensemble. Here's an example that loads the handwritten digit dataset (used for demonstrations later with other ensemble algorithms) and then fits the model by bagging:
from sklearn.datasets import load_digits
digit = load_digits()
X, y = digit.data, digit.target
from sklearn.ensemble import BaggingClassifier
from sklearn.tree import DecisionTreeClassifier
from sklearn.model_selection import cross_val_score
from sklearn.model_selection import KFold
tree_classifier = DecisionTreeClassifier(random_state=0)
crossvalidation = KFold(n_splits=5, shuffle=True,
random_state=1)
bagging = BaggingClassifier(tree_classifier,
max_samples=0.7,
max_features=0.7,
n_estimators=300)
scores = np.mean(cross_val_score(bagging, X, y,
scoring='accuracy',
cv=crossvalidation))
print ('Accuracy: %.3f' % scores)
Here's the cross-validated accuracy for the bagging applied to the handwritten dataset:
Accuracy: 0.967In bagging, as in Random Forest, the more models in the ensemble, the better. You run little risk of overfitting because every model is different from the others, and errors tend to spread around the real value. Adding more models just adds stability to the result.
Another characteristic of the algorithm is that it permits estimation of variable importance while taking the presence of all the other predictors into account. In this way, you can determine which feature is important for predicting a target given the set of features that you have; also, you can use the importance estimate as a guideline for variable selection.
In contrast to single decision trees, you can’t easily visualize or understand Random Forest, making it act as a black box (a black box is a transformation that doesn’t reveal its inner workings; all you see are its inputs and outputs). Given its opacity, importance estimation is the only way to understand how the algorithm works with respect to the features.
Importance estimation in a Random Forest is obtained in a straightforward way. After building each tree, the code fills each variable in turn with junk data and the example records how much the predictive power decreases. If the variable is important, crowding it with casual data harms the prediction; otherwise, the predictions are left almost unchanged and the variable is deemed unimportant.Working with a Random Forest classifier
The example Random Forest classifier keeps using the previously loaded digit dataset:X, y = digit.data, digit.target
from sklearn.ensemble import RandomForestClassifier
from sklearn.model_selection import cross_val_score
from sklearn.model_selection import KFold
crossvalidation = KFold(n_splits=5, shuffle=True,
random_state=1)
RF_cls = RandomForestClassifier(n_estimators=300,
random_state=1)
score = np.mean(cross_val_score(RF_cls, X, y,
scoring='accuracy',
cv=crossvalidation))
print('Accuracy: %.3f' % score)
The cross-validated accuracy reported by this code for the Random Forest is an improvement over the bagging method:
Accuracy: 0.977Just setting the number of estimators is sufficient for most problems you encounter, and setting it correctly is a matter of using the highest number possible given the time and resource constraints of the host computer. You can demonstrate this by calculating and drawing a validation curve for the algorithm.
from sklearn.model_selection import validation_curve
param_range = [10, 50, 100, 200, 300, 500, 800, 1000, 1500]
crossvalidation = KFold(n_splits=3,
shuffle=True,
random_state=1)
RF_cls = RandomForestClassifier(n_estimators=300,
random_state=0)
train_scores, test_scores = validation_curve(RF_cls, X, y,
'n_estimators',
param_range=param_range,
cv=crossvalidation,
scoring='accuracy')
mean_test_scores = np.mean(test_scores, axis=1)
import matplotlib.pyplot as plt
plt.plot(param_range, mean_test_scores,
'bD-.', label='CV score')
plt.grid()
plt.xlabel('Number of estimators')
plt.ylabel('accuracy')
plt.legend(loc='lower right', numpoints= 1)
plt.show()
The image below shows the results provided by the preceding code. The more estimators, the better the results. However, at a certain point the gain becomes minimal indeed.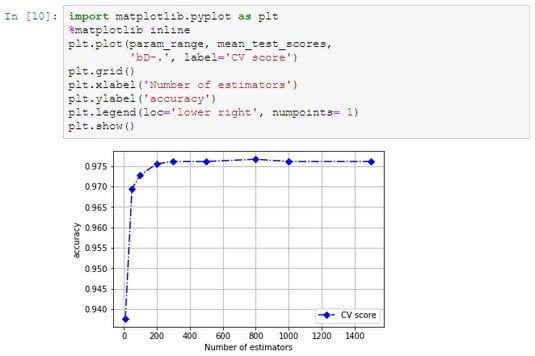 Verifying the impact of the number of estimators on Random Forest.
Working with a Random Forest regressor
RandomForestRegressor works in a similar way as the Random Forest for classification, using exactly the same parameters:X, y = boston.data, boston.target
from sklearn.ensemble import RandomForestRegressor
from sklearn.model_selection import cross_val_score
from sklearn.model_selection import KFold
RF_rg = RandomForestRegressor (n_estimators=300,
random_state=1)
crossvalidation = KFold(n_splits=5, shuffle=True,
random_state=1)
score = np.mean(cross_val_score(RF_rg, X, y,
scoring='neg_mean_squared_error',
cv=crossvalidation))
print('Mean squared error: %.3f' % abs(score))
Here is the resulting cross-validated mean squared error:
Mean squared error: 12.028
The Random Forest uses decision trees. Decision trees https://www.dummies.com/programming/big-data/data-science/how-to-create-classification-and-regression-trees-in-python-for-data-science/ segment the dataset into small partitions, called leaves, when estimating regression values. The Random Forest takes the average of the values in each leaf to create a prediction. Using this procedure causes extreme and high values to disappear from predictions because of the averaging used for each leaf of the forest, producing dumped values instead of much higher or much lower values.
Optimizing a Random Forest
Random Forest models are out-of-box algorithms that can work quite well without optimization or worrying about overfitting. (The more estimators you use, the better the output, depending on your resources.) You can always improve performance by removing redundant and less informative variables, fixing a minimum leaf size, and defining a sampling number that avoids having too many correlated predictors in the sample. The following example shows how to perform these tasks:from sklearn.ensemble import RandomForestClassifier from sklearn.model_selection import KFold X, y = digit.data, digit.target crossvalidation = KFold(n_splits=5, shuffle=True, random_state=1) RF_cls = RandomForestClassifier(random_state=1) scorer = 'accuracy'Using the handwritten digit dataset and a first default classifier, you can optimize both
max_features and min_samples_leaf. When optimizing max_features, you use preconfigured options (auto for all features, sqrt or log2 functions applied to the number of features) and integrate them using small feature numbers and a value of 1/3 of the features. Selecting the right number of features to sample tends to reduce the number of times when correlated and similar variables are picked together, thus increasing the predictive performances.There is a statistical reason to optimize min_samples_leaf. Using leaves with few cases often corresponds to overfitting to very specific data combinations. You need to have at least 30 observations to achieve a minimal statistical confidence that data patterns correspond to real and general rules:
from sklearn.model_selection import GridSearchCV
max_features = [X.shape[1]//3, 'sqrt', 'log2', 'auto']
min_samples_leaf = [1, 10, 30]
n_estimators = [50, 100, 300]
search_grid = {'n_estimators':n_estimators,
'max_features': max_features,
'min_samples_leaf': min_samples_leaf}
search_func = GridSearchCV(estimator=RF_cls,
param_grid=search_grid,
scoring=scorer,
cv=crossvalidation)
search_func.fit(X, y)
best_params = search_func.best_params_
best_score = search_func.best_score_
print('Best parameters: %s' % best_params)
print('Best accuracy: %.3f' % best_score)
The best parameters and best accuracy obtained are then reported, highlighting that the parameters to act on is the number of trees:
Best parameters: {'max_features': 'sqrt',
'min_samples_leaf': 1,
'n_estimators': 100}
Best accuracy: 0.978