
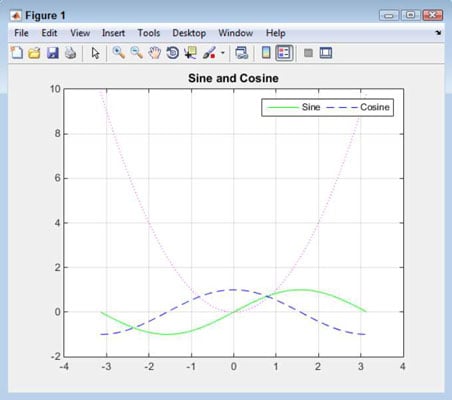
MATLAB allows you to display your plots however you choose. Here are three plots — one on top of the other. You don’t have to display the plots in this manner. Instead, you can display them side by side (or even in a grid). To make this happen, you use the subplots feature of MATLAB. A subplot is simply a plot that takes up only a portion of the display.
Creating a subplot
The best way to understand subplots is to see them in action. The following steps help you create the three previous plots as subplots:
Type clf and press Enter.
MATLAB clears any previous plot you created.
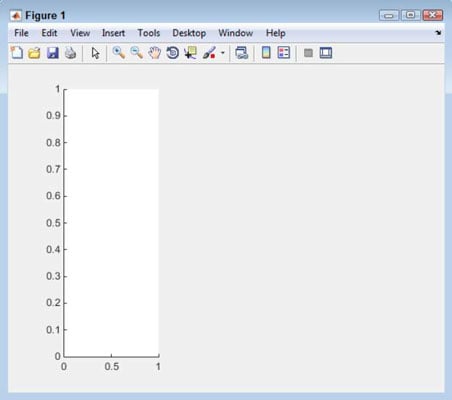
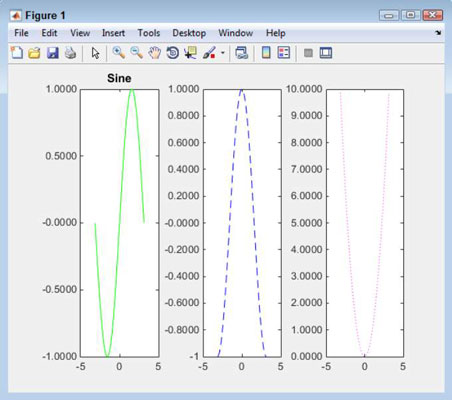
Type subplot(1, 3, 1) and press Enter.
This function creates a grid consisting of one row and three columns. It tells MATLAB to place the first plot in the first space in the grid. You see the blank space for the plot.
Type p1 = plot(x, sin(x), ‘g-’) and press Enter.
You see the first plot added to the display.
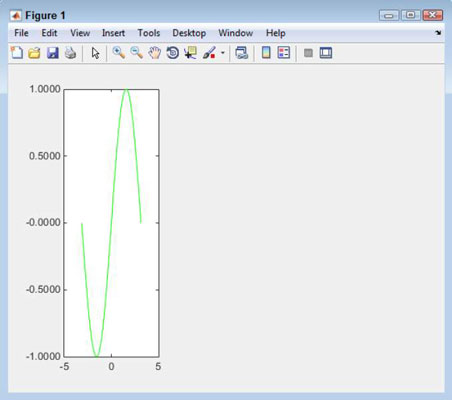
Notice that the example is creating the plots one at a time. You can’t combine plots in a single call when using subplots. In addition, you need to maintain a handle to each of the plots in order to configure them
Type subplot(1, 3, 2) and press Enter.
MATLAB selects the second area for the next plot.
Type p2 = plot(x, cos(x), ‘b-’) and press Enter.
You see the second plot added to the display.
Type subplot(1, 3, 3) and press Enter.
MATLAB selects the third area for the next plot.
Type p3 = plot(x, power(x, 2), ‘m:’) and press Enter.
You see the third plot added to the display.
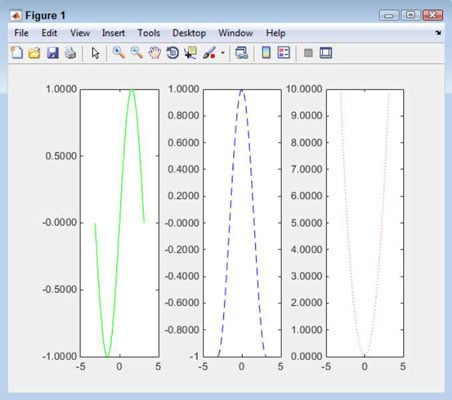
Each plot takes up the entire area. You can’t compare plots easily because each plot is in its own space and uses its own units of measure. However, this approach does have the advantage of letting you see each plot clearly.
Changing subplot information
The subplot() function doesn’t change anything — it merely selects something. For example, some plots lack titles. To add a title to the first plot, follow these steps:
Type subplot(1, 3, 1) and press Enter.
MATLAB selects the first subplot.
Type title(‘Sine’) and press Enter.
You see a title added to the first subplot.
Configuring individual plots
To work with a subplot in any meaningful way, you need to have a handle to the subplot. The following steps describe how to change the color and line type of the second plot:
Type subplot(1, 3, 2) and press Enter.
MATLAB selects the second subplot. Even though the handle used with the set() command in the following step will select the subplot for you, this step is added so that you can actually see MATLAB select the subplot. Sometimes, performing this task as a separate step is helpful to ensure that any function calls that follow use the correct subplot, even when these function calls don’t include a handle.
When you start creating scripts, you find that errors creep into scripts when you’re making assumptions about which plot is selected, rather than knowing for sure which plot is selected.
Type set(p2, ‘color’, ‘r’) and press Enter.
The line color is now red. The set() function accepts a handle to a plot or another MATLAB object as the first value, the name of a property as the second, and the new value for that property as the third. This function call tells MATLAB to change the color property of the line pointed at by p2 to red.
Type set(p2, ‘LineStyle’, ‘-.’) and press Enter.
The LineStyle property for the Cosine plot is now set to dash dot.
