At some point, you’ll want to change the content of your plot in MATLAB. Perhaps you want to add a legend or change how the data is presented. After you get the data looking just right, you might need to label certain items or perform other tasks to make the output look nicer. You can modify any plot you create using either commands or the MATLAB GUI.
The modification method that you use is entirely up to you. Some people work better at the keyboard, others using the mouse, and still others using a combination of the two. Working at the keyboard is a lot faster but requires that you memorize the commands to type.
The GUI provides you with great memory aids, but working with the mouse is slower and you might not be able to find a particular property you want to change when it becomes buried in a menu somewhere.
Making simple changes
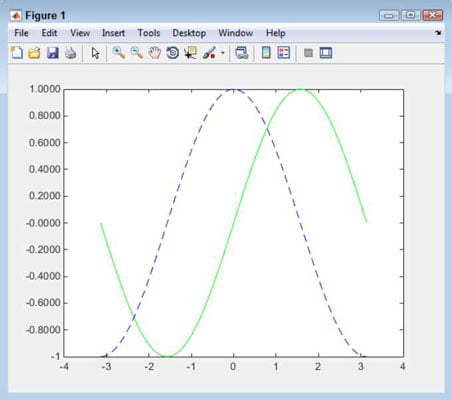
There are a number of simple changes you can make to your plot that don’t require any special handling other than to type the command. For example, to add a grid to an existing plot, you simply type grid on and press Enter. (MATLAB has a number of grid commands. For example, grid MINOR toggles the minor grid lines.)
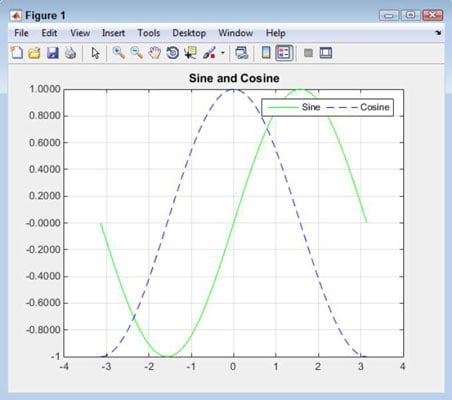
Adding a legend means typing a name for each of the plots. For example, if you want to add a legend to this plot, you type legend(‘Sine', ‘Cosine') and press Enter. You can also change items such as the legend orientation.
The default orientation is vertical, but you can change it to horizontal by typing legend(‘orientation', ‘horizontal') and pressing Enter. Notice that the property name comes first, followed by the property value.
MATLAB also lets you add titles to various parts of the plot. For example, to give the plot a title, type title(‘Sine and Cosine’) and press Enter. You can also provide labels for the x-axis using xlabel() and for the y-axis using ylable(). The point is that you have full control over the appearance of the plot.
Here, you can see the effects of the commands that you have tried so far.
If you make a mistake, you can always clear the current plot by using the clf command. The clf command does for the plot what the clc command does for the Command window. Make sure that you actually want to clear the plot before using the clf command because there isn’t any sort of undo feature to restore the plot.
Adding to a plot
You may decide that you want to add another plot to an existing plot. For example, you might want to plot the square of x for each of the values used in the previous examples. To make this technique work, you need to perform the three-step process described here:
Type hold on and press Enter.
If you try to add another plot without placing a hold on the current plot, MATLAB simply creates a new plot and gets rid of the old one. The hold command lets you retain the current plot while you add something to it.
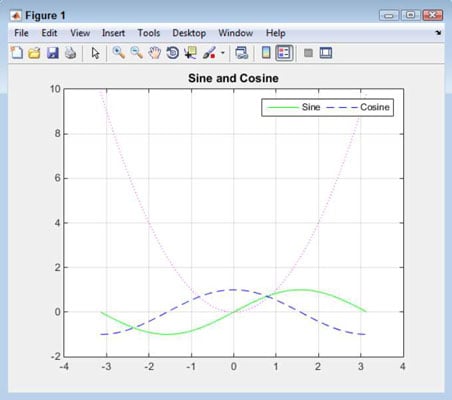
Type newplot = plot(x, power(x, 2), ‘m:’) and press Enter.
This command creates a new plot and places a handle to that plot in newplot. A handle is just what it sounds like — a means of obtaining access to the plot you just created. If you don’t store the plot handle, you can’t access it later.
Notice that the legend hasn’t updated itself to show the new plot. To update the legend, you must issue another legend() function call. The sine and cosine still have the same values, but the new plot has much larger values, so it appears that the previous plot lines have shrunk. However, compare the values and you see that the values of sine and cosine are the same.
Type hold off and press Enter.
The hold off command releases the plot. To create new plots, you must release your hold on the existing plot.
Deleting a plot
You might decide that you really don’t want to keep a plot you’ve added. In this case, you need a handle to the plot you want to remove. To remove the plot, type delete(newplot) and press Enter. MATLAB removes the plot from the display.