Fundamental analysts decide what to buy, and technical analysts decide when to buy (timing).
Not only do technical analysts chart the market, but they also chart individual securities. Technical analysts try to identify market patterns and patterns of particular stocks in an attempt to determine the best time to purchase or sell. Even though a stock’s price may vary a lot from one day to another, when plotting out stock prices over a long period of time, the prices tend to head in a particular direction (up, down, or sideways) and create a trendline.Benchmarks and indices
If you watch news stations, read the newspaper, listen to the radio, and so on, you can’t help but see or hear about the DJIA (Dow Jones Industrial Average) or the NASDAQ being up or down. Well, those are indices (indexes) or benchmarks. Benchmarks are typically used to evaluate the performance of individual investments or a group of investments. Most investors compare their investments to certain broad-based indices or narrow-based indices:- Narrow-based: Narrow-based indices indicate the performance of a particular industry such as the Dow Jones Transportation Index.
- Broad-based: Broad-based indices are more indicative of the overall market. Broad-based indices measure securities from many different industries.
There are certainly more indices than the ones listed, but for the Securities Industry Essentials Exam purposes, you shouldn’t need to memorize them but mainly understand what indices are and that they are often used as benchmarks.
Here are examples of some of the broad-based stock indices:- Standard & Poor’s 500 Index (S&P 500): Includes 500 large-cap listed common stocks.
- Wilshire 5000 Total Market Index: The largest of all stock indexes; includes 5,000 listed common stocks.
- Russell 2000 Index: An index of 2,000 small-cap (smaller-sized) companies.
- Lipper Indexes: Track the financial performance of different mutual funds based on their investment strategy. Each Lipper Index tracks the performance of only the largest fund in each category (large-cap growth, mid-cap value, international fund, and so on).
- Dow Jones Composite Average: An index that tracks 65 stocks from some of the most prominent companies. The Dow Jones Composite is broken down into:
- DJIA: Tracks 30 stocks from the industrial sector. The DJIA is the most commonly used index to indicate the performance of the market in general.
- Dow Jones Transportation Average: Tracks 20 stocks from the transportation sector.
- Dow Jones Utility Average: Tracks 15 stocks from the utility sector.
Proponents of the Dow Theory believe that major market trends are confirmed if the DJIA and the Down Jones Transportation Average are trending in the same direction (that is, both advancing or both declining). Logic dictates that if industrial companies are producing more goods, then those same goods need to be transported.
Most of the indices listed previously are weighted toward the larger companies. This means that price movement of the larger companies has a greater impact on the particular index than a smaller company does.Stages of the business cycle
The business cycle is the natural rise and fall of goods and services (Gross Domestic Product, or GDP) that occur over time. The business cycle has four phases that will occur over and over again.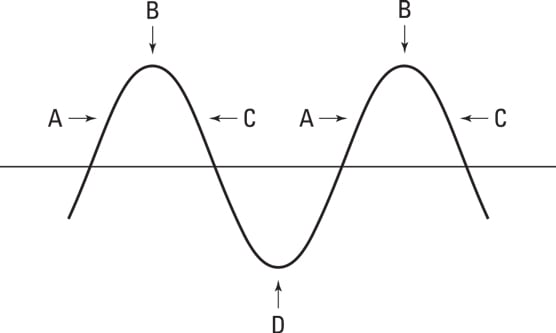 The four phases of the business cycle
- Expansion (A in the figure): Expansion is characterized by increasing demand for goods and services. During expansion, the stock market is generally increasing (bullish), property values are increasing, and industrial production is increasing. Expansion also can be characterized as recovery.
- Peak (B in the figure): The peak occurs at the top of the expansion phase and happens right before the economy starts to contract.
- Contraction (C in the figure): Contraction is characterized by higher levels of consumer debt, a stock market that is generally decreasing (bearish), a decreasing demand for goods and services, and an increasing number of bond defaults and bankruptcies.
- Trough (D in the figure): Trough is the lowest part of the contraction phase and happens right before the economy starts to expand (recover) again.
If asked to place them in order on the SIE exam, you can put them in order just as they’re given in the preceding list.
Bullish versus bearish
When thinking of whether the market is bullish or bearish, think of the terms. You can think of bullish as charging ahead. So, if the market is bullish, it is generally increasing in value. If the market is bearish, it is generally hibernating or sleeping. When the market is bearish, it is generally decreasing in value.Individuals can be bullish or bearish on the market, in general, or bullish or bearish on certain securities.
- Bullish strategies include buying individual stocks, buying mutual funds, buying call options, selling uncovered [naked] put options, and so on.
- Bearish strategies include selling short individual stocks, buying bearish funds (funds that generally increase in value in a declining market), buying inverse exchange-traded funds, selling uncovered [naked] call options, buying put options, and so on.