
Assessing data quality for data science
Another fundamental part of data understanding involves gaining a detailed view of the quality of the data as soon as possible. Many businesses consider data quality and its impact too late — well past the time when it could have had a significant effect on the project’s success. By integrating data quality with operational applications, organizations can reconcile disparate data, remove inaccuracies, standardize on common metrics, and create a strategic, trustworthy, and valuable data asset that enhances decision making. Also, if an initial analysis suggests that the data quality is insufficient, steps can be taken to make improvements. One way to refine the data is by removing unusable parts; another way is to correct poorly formatted parts.Start by asking yourself questions such as these: Is the data complete? Does it cover all required cases? Is it correct, or does it contain errors? If there are errors, how common are they? Does the data have missing values? If so, how are they represented, where do they occur, and how common are they?
A more structured list of data quality checkpoints includes steps such as these:- Check data coverage (whether all possible values are represented, for example).
- Verifying that the meaning of attributes and available values fit together. For example, if you are analyzing data on geographical location for retail stores, is the value captured in latitude and longitude, rather than the name of the regional area it is placed in?
- Identifying missing attributes and blank fields.
- Classifying the meaning of missing or wrong data, and double-check attributes with different values but similar meanings.
- Checking for inconsistencies in the spelling and formatting of values (situations where the same value sometimes starts with a lowercase letter and sometimes with an uppercase letter, for example). Without consistent naming conventions and numerical format, data correlation and analysis will not be possible cross data sets.
- Reviewing deviations and deciding if any of them qualify as mere noise (outliers) or indicate an interesting phenomenon (pattern).
- Check whether there is noise and inconsistencies between data sources.
If you detect data quality problems as part of the quality check, you need to define and document the possible solutions. Focus on attributes that seem to go against common sense; visualization plots, histograms, and other ways of visualizing and exploring data are great ways to reveal possible data inconsistencies. It may also be necessary to exclude low-quality or useless data entirely in order to perform the needed analysis.
The image below shows table formatted to show an overview of a data set. Tables like these are a good way to get a first overview of your data from a quality perspective because it uses descriptive statistics to quickly detect extreme values in terms of things like minimum values, maximum values, median, medium, and standard deviation. The table also allows us to analyze the key values to make sure that they are 100% unique and do not include any duplicated or missing values. If you are studying data related to your customers, for example, you want to make sure that a customer does not occur twice due to a spelling error — or is missing from the list altogether!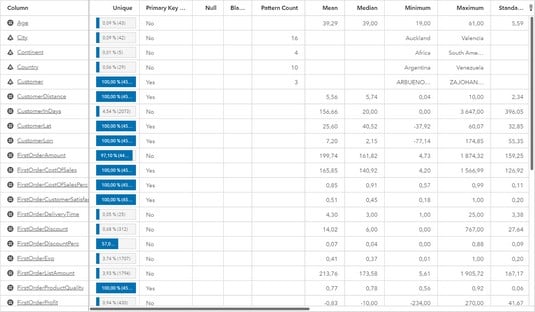 Profiling the data to get an overview of the data quality.
Image based on a screenshot generated using SAS® Visual Analytics software. Copyright © 2019 SAS Institute Inc., Cary, NC, USA. SAS and all other SAS Institute Inc. product or service names are registered trademarks or trademarks of SAS Institute Inc. All Rights Reserved. Used with permission.
The following image shows a graphical visualization of the same data, but this graph focuses on just one column; country. By looking at the data from a country perspective, you can validate the data distribution in another way, and possibly detect inconsistencies or missing values that were difficult to detect from the overview. In this specific example, the tool actually has a functionality called Pattern which indicates when data values are deviating from the norm.
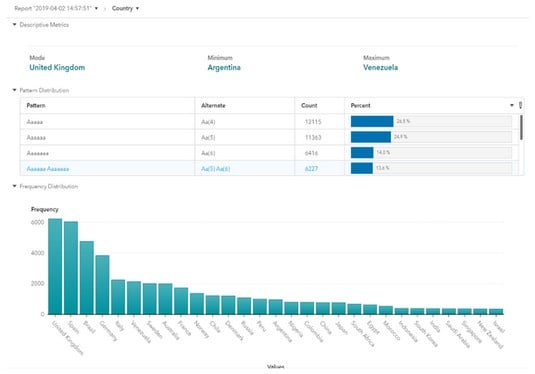 Data profiling and validation from a country perspective.
Image based on a screenshot generated using SAS® Visual Analytics software. Copyright © 2019 SAS Institute Inc., Cary, NC, USA. SAS and all other SAS Institute Inc. product or service names are registered trademarks or trademarks of SAS Institute Inc. All Rights Reserved. Used with permission.
Ask any thriving organization the secret to success and you’ll get many answers: a solid data strategy, or calculated risks in combination with careful budgeting. They’re all good business practices which come from the same place: a solid foundation of high-quality data. When you have accurate, up-to-date data driving your business, you’re not just breaking even — you’re breaking records. A data quality assessment process is essential to ensure reliable analytical outcomes. This process depends on human supervision-driven approaches since it is impossible to determine a defect based only on data.
Improving data quality for data science
So, what do you do, practically speaking, if you realize that your data quality is really bad? Use the four-step approach outlined below to get started on highlighting the gaps and defining a road map to implement needed improvements in data quality.- Scope: Define the data quality problem and describe the business issue related to the quality problem. Specify data details and business processes, products and/or services impacted by the data quality issues.
- Explore: Conduct interviews with key stakeholders on data quality needs and expectations, as well as data quality problems. Review data quality processes and tool support (if any) across business functions and identify needed resources for the quality improvement activity.
- Analyze: Assess current practices against industry best practices for data quality and align it with the findings from the exploration phase.
- Recommend: Develop a road map for improving the data quality process and define how the technical architecture for the data quality process must look like, incorporating your findings of what is not working today and what is essential from a business perspective.
If you want to take extra measure to ensure the success of your data science strategy, make sure you are implementing modern data architecture.