Data miners work fast. One way to improve your productivity is to take full advantage of tools that let you do several things at once. It’s time-consuming (and boring) to set up a number of graphs separately, one at a time. So use these alternatives whenever you can:
Data summaries
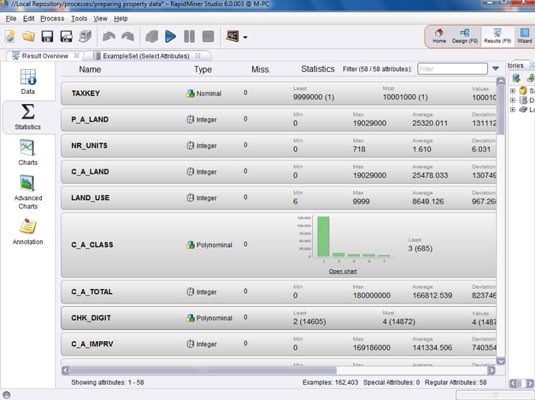
Tools that let you quickly ask for summaries of many variables, and get the summaries all at once. Bar charts and histograms are often included in the output.
Chart matrix
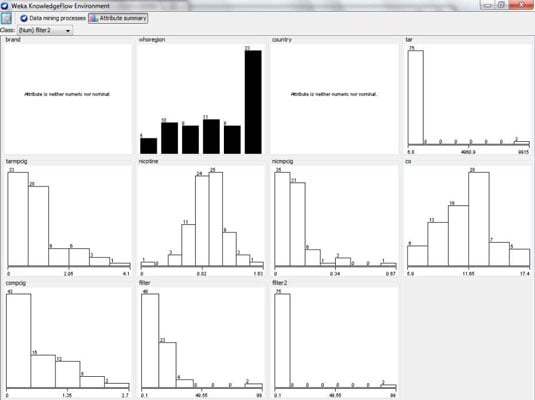
The output is a grid (matrix) of small bar charts and histograms, so you can review many data distributions quickly.
Scatterplot matrix
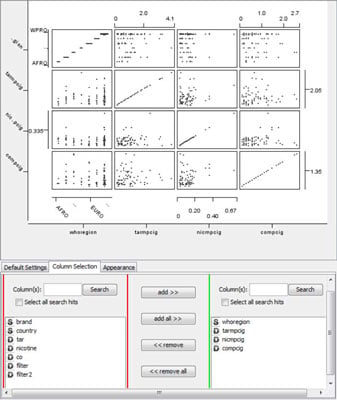
A grid of small scatterplots. Each small graph shows the relationship for a single pair of variables (usually uses continuous variables). You input a list of variables, and the scatterplot matrix shows you every possible pairing.