A channel in a trading chart is a pair of straight-line trendlines encasing a price series. This channel consists of one line drawn along the top of a price series and another line, parallel to the first, along the bottom of the price series. You can often draw a channel on a real security.
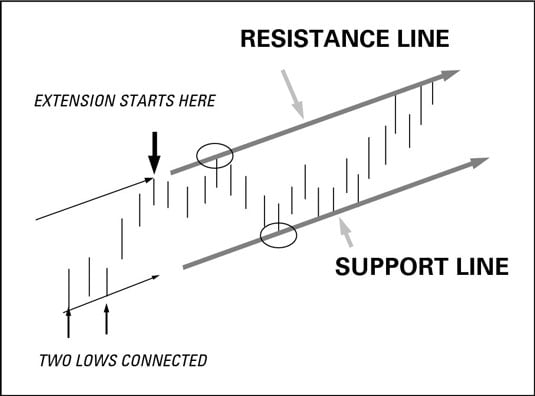
In the trading chart you’ve drawn up, connect the two lows at the lower left.
This is the support line. They’re the two relative lows because a bar with a higher low comes in between.
With your ruler, extend that line into the future.
You can also extend the line through the magic of software, if you don’t feel like drawing this channel by hand.
To form the top of the channel, go back to the highest high and start a line (called the resistance line) parallel to the support line from it.
A relative high can be seen only after you get an intervening lower high (got that?). On the chart, the highest high is the last of three higher highs.
Extend the resistance line into the future.
Note that sometimes you later get a higher high and have to shift the entire resistance line up, keeping it parallel. Oddly, a high proportion of new highs stop at the old resistance line, even though some stop at the new resistance line, too. It’s like having two equally valid resistance lines. To be on the safe side, consider the farther-away channel line as the more-important one.