
The most popular trading price volatility measure is the Bollinger band, invented by John Bollinger. He charted a simple 20-day moving average of the closing price with a band on either side consisting of two standard deviations of the moving average, effectively capturing about 95 percent of the variation away from the average.
You use Bollinger bands to display the price in the context of a norm set at the 20-day moving average, which is the number of days that Bollinger’s research showed is the most effective in detecting variance in U.S. equities. The bands display relative highs and relative lows in the context of the moving average — they’re adaptive to the price by the amount of the standard deviation. The bands are, so to speak, moving standard deviations.
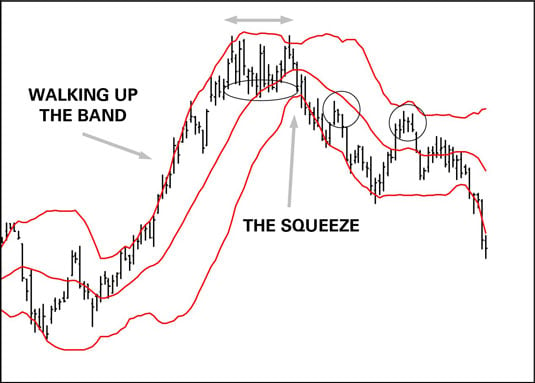
At some point, every price thrust exhausts itself. Bollinger bands display the end of the up move in two ways:
The price bar stops hugging the top band in an up move, and slides down to the center moving average (or farther). In the preceding figure, the retreat to the moving average occurs at the ellipse. As a general rule, the failure to make a relative new high signals the end of the move, although this time, the bulls made a second effort to keep the rally going. In this case, the price was forming a double top.
The bands contract. When the bands contract, the range is narrowing. Traders are having second thoughts. They aren’t willing to test a new high, but they aren’t willing to go short and generate new lows, either.
The narrowing of the trading range is named the squeeze and implies an impending breakout. The preceding figure displays a reversal, but a reversal isn’t the inevitable outcome. Breakouts can occur in the same direction as the original move, too. In this case, the downside breakout of the bottom of the band occurred unusually quickly after an upside breakout of the top band.
A rapid break of the opposite band is sometimes a head fake. In the case of a downside move, traders could have been overly exuberant in taking profits after such a big run up to the high. The preceding figure shows an upward pullback from the down move in the two circles. Sometimes pullbacks keep going, and the price resumes the uptrend — although hardly ever after breaking the bottom band like this one. To detect head fakes, use Bollinger bands with other confirming indicators, especially momentum indicators.