The stochastic oscillator cycles between 0 and 100 percent. Readings of more than 80 percent imply an overbought condition. Readings of less than 20 percent are interpreted as an oversold condition. As with most indicators, an overbought condition can be resolved if a stock trades lower or enters a period of consolidation. Similarly, an oversold condition can be resolved if a stock trades higher or enters a period of consolidation.
Overbought and oversold conditions can persist for extended periods of time, so when the indicator line crosses above the 80 percent threshold or below the 20 percent level, it’s not an immediate signal to sell or buy. Although this move should tell you to keep a close eye on things in case a sudden reversal is initiated, the real stochastic oscillator signals are generated in the following circumstances:
- When the stochastic oscillator moves from below to above 20 percent, triggering a buy signal
- When the stochastic oscillator moves from above to below 80 percent, triggering a sell signal
Also, note that few of the indicator’s sell signals, where the stochastic oscillator crosses below 80 percent, represented good selling or shorting opportunities while Alaska was trending higher. (Note:This figure shows a slow stochastic oscillator with the parameters 14, 3 positioned below the chart.)
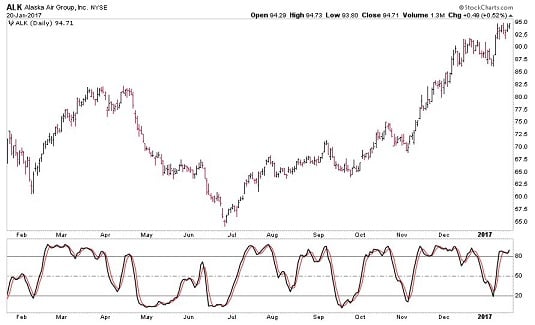 Chart courtesy of StockCharts.com
A chart of Alaska Air with the slow stochastic oscillator below the price chart.
Some traders use a stochastic oscillator crossover strategy, where buy signals are triggered when %K crosses above %D, and sell signals are triggered when %K crosses below %D. For our style of trading, that generates too many signals, a very high percentage of which are false.
The stochastic oscillator is most effective when used in conjunction with other technical indicators. When a stock is trending, the stochastic oscillator is useful in finding entry points within a dominant trend. In an uptrend, for example, a buy signal that’s generated when the stochastic oscillator moves from below to above 20 percent is likely to be a reliable one. At the same time, however, the stochastic oscillator signals many overbought conditions within an uptrend and rarely generates useful sell signals. For this reason, it’s wise to pair the stochastic oscillator with other indicators to help generate useful sell signals in an uptrend.
The stochastic oscillator also works well in trading‐range situations. Many short‐term traders use it to trigger buy and sell signals when a stock is in a trading range.