- Relative strength indicators against the rest of the market can be helpful on a weekly line chart. You want your chart to outperform other markets. The SCTR and a ratio chart of the stock compared to the S&P 500 ($SPX), the industry group, or the sector is one such example of an indicator you may want to use. The SCTR (which stands for StockCharts technical ranking) refines the information down to a number rather than just a trend.
- Using the Chaikin money flow (CMF) helps identify whether the underlying price action is improving. On-balance volume (OBV) or accumulation/distribution can also help.
- The price panel is very clean with only a single line on it. Adding some moving average(s) or a price channel would be helpful information so you can more easily see when the price moves above or below the average. In this chart, the 40-day moving average was used; a 200-day moving average could also be useful. The horizontal line at the top shows the highest stock price or resistance level, which in this chart appears to be the point at which the stock price resists going higher.
- Volume is always valuable in case some clues are hiding there. For example, on high-volume days there likely was some type of news that drove stock sales. If you see a high-volume day, be sure to check the news about the stock before making any trading decisions. The price change you’re seeing may be a very short-term reaction to the news of the day.
- The percentage price oscillator (PPO) shows momentum. Choices also include the know sure thing (KST), moving average convergence divergence indicator (MACD), or price momentum oscillator (PMO).
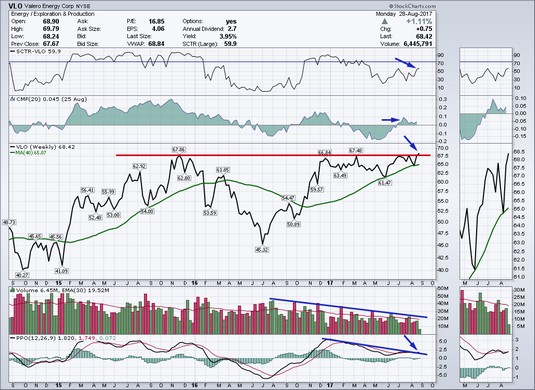 Chart courtesy of StockCharts.com
A weekly line chart.
So what are you looking for when you trade with a custom weekly line chart? In the case of the image above, each indicator is giving you positive signals as the price is breaking out. Breakout traders would buy this breakout and sell if it moved back below the breakout level. Here are the details on each panel:
- You can see the SCTR is moving above 60. It is not great, but it is still outperforming 60 percent of the peer group. If it continues to move above 75, that would reinforce the bullish case.
- The CMF recently turned positive.
- The price is breaking out to new highs. That is how new bull moves start. The price is making higher highs, leaving the consolidation behind. The 40-week moving average is trending higher.
- The volume is drying up, suggesting an explosive move if volume starts to expand. Notice that the two previous summers had significantly higher volumes. Six of the last eight weeks had lower volumes similar to Christmas or Thanksgiving short weeks.
- The PPO just broke above a downtrend in momentum while above zero, which is very bullish.
In particular, note that the chart settings for a weekly period were set for a range of three years. A simple moving average of 40 days was used and set the color to green so it would stand out from the black line used for the price. Several indicators were also added: SCTR Line, Chaikin Money Flow (CHF), Volume, and Pct Price Oscillator (PPO). Change the indicators and overlays to create your own optimized chart.
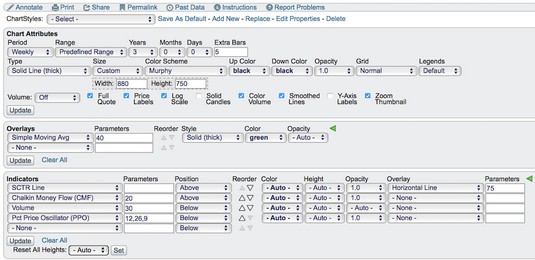 Chart courtesy of StockCharts.com
Settings for a weekly line chart.