
In technical analysis for well-timed trading of investments, the price bar describes and defines the trading action in a security for a given period. The price bar and its placement on the chart deliver a lot of information about market sentiment.
It doesn’t take much practice to start reading the mind of the market by looking at bars and small patterns. You have to be patient, imaginative, and thoughtful, but the payoff is cold, hard cash.
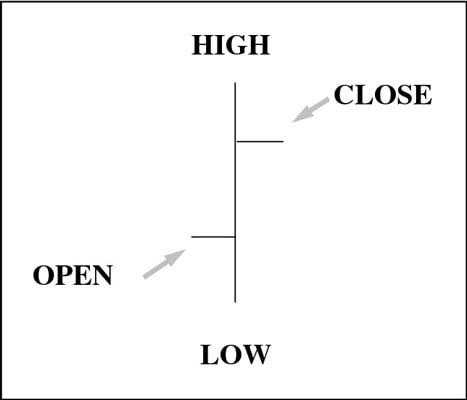
Price bars consist of four components — open, high, low, and close, abbreviated OHLC:
Open: The horizontal line on the left is the opening price.
High: The top of the vertical line defines the high of the day.
Low: The bottom of the vertical line defines the low of the day.
Close: The horizontal line on the right is the closing price.
Price bars can encompass different periods, anything from a minute to a month. The scope of the period doesn’t change the price bar dynamics.
The two horizontal lines on the price bar are called tick marks. In trading parlance, a tick represents a single trade at a single price, so the tick mark representing the open or the close refers literally to a single transaction or to a batch of transactions all at the same price and at the same time.
The price bar tells you the outcome of the battle between the buyers (bulls) and the sellers (bears). Hidden in every price bar is a winning group and a losing group. If the price opened at the low and closed at the high, the winners that day were the buyers.
If the price opened at the high and closed at the low, the winners that day were the sellers. If the bar is very tall, encompassing a $10 range when the normal bar for this security is only $3, the trading was a titanic battle. If the bar is very short, say $1, it was a mere pillow fight.