You can become more familiar with some common and dependable candlestick patterns by checking out the following figures. (Remember, they don’t represent every possible candlestick pattern.)
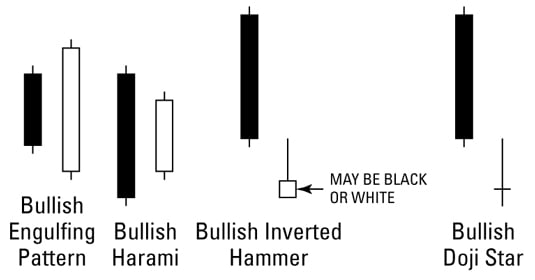
Bullish two-day trend reversal patterns
These charts are a few of the most common and reliable bullish two-day trend reversal patterns in an uptrend.
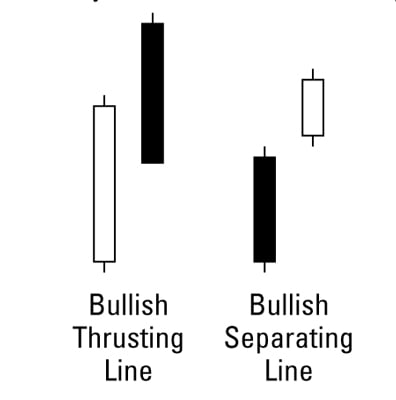
Bullish two-day trend continuation patterns
These patterns are common and reliable examples of bullish two-day trend continuation patterns in an uptrend.
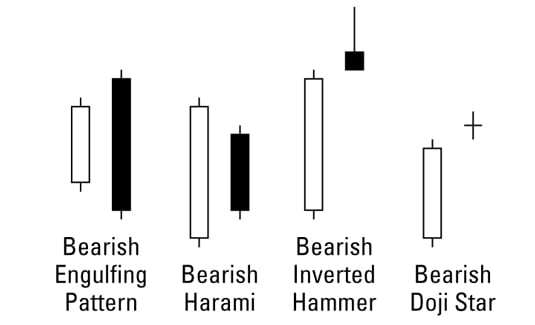
Bearish two-day trend reversal patterns
These figures shows some of the most common and reliable types of bearish two-day trend reversal patterns in an uptrend.
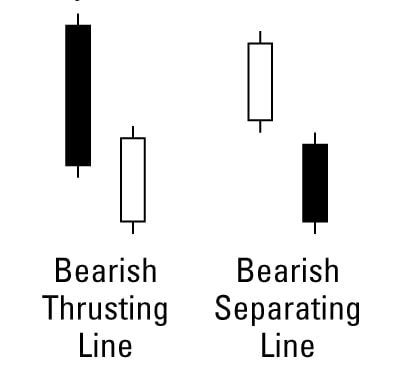
Bearish two-day trend continuation patterns
These reliable two-day trend continuation patterns may show up frequently as you look through your candlestick charts.
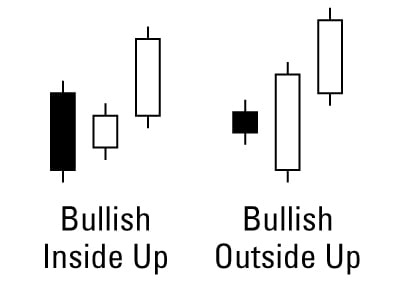
Bullish three-day trend reversal patterns
Here are a couple common bullish three-day trend reversal patterns.
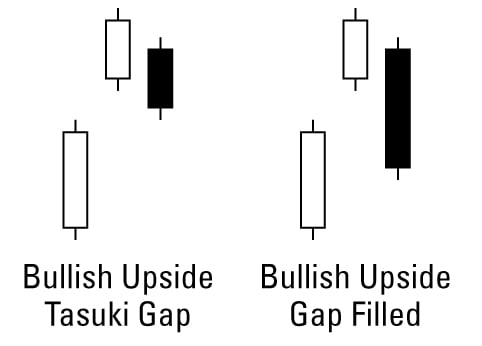
Bullish three-day trend continuation patterns
These two patterns are common examples of bullish three-day trend continuation patterns.
Bearish three-day trend reversal patterns
These are a couple of the most common bearish three-day trend reversal patterns.
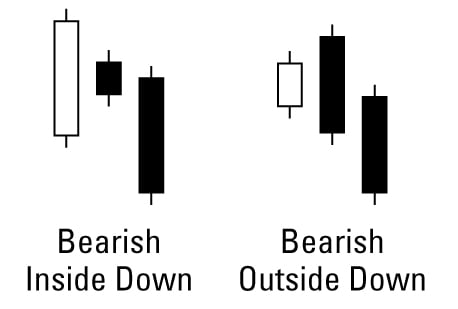
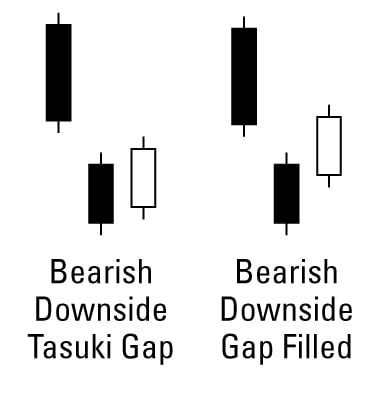
Bearish three-day trend continuation patterns
Here are two common examples of bearish three-day trend reversal patterns.