
For investment purposes, each source of energy is considered its own market sector. Fossil fuels — or, more precisely, nonrenewable fuels like oil, natural gas, coal, and nuclear — dominate global energy consumption, with a 92 percent market share. Renewable fuels like hydroelectricity, solar, wind, and biofuels account for just 8 percent.
Oil
Oil in all its forms accounts for one third of global energy consumption. This includes crude oil, shale oil, oil sands, and the liquid content of natural gas, called natural gas liquids, or NGLs. As a result of including these different forms, you sometimes see different numbers depending on the source and whether it’s reporting just crude oil or total liquids.
Oil is traded by the barrel, which contains 42 gallons. The common unit used for oil is thousand barrels per day, abbreviated tb/d. This table shows world oil consumption and production in multiple units.
| Unit | Consumption | Production |
|---|---|---|
| Thousand barrels per day | 88,034 | 83,576 |
| Million barrels per day | 88.034 | 83.576 |
| Million tonnes per year | 4,059.1 | 3,995.6 |
Natural gas
Natural gas accounts for just under one-quarter of global energy consumption. You can measure natural gas by volume, usually in cubic meters or feet, or by the amount of heat it can produce in therms, or British thermal units (Btus). This table shows how these units relate to each other.
| Cubic Feet | Btus | Therms |
|---|---|---|
| 1 | 1,000 | 0.01 |
| 0.001 | 1 | 0.00001 |
| 100 | 100,000 | 1 |
Because such large quantities of natural gas are needed and produced, you commonly come across units for thousands, millions, or billions of cubic feet and Btus. You can simplify them like this:
1,000 cubic feet (cf) = 1 Mcf
1 million Mcf = 1 billion cubic feet (Bcf)
1,000 bcf = 1 trillion cubic feet (Tcf)
1 million Btu = 1,000 MBtu = 1 MMBtu
In 2011, the world produced 115.7 trillion cubic feet of natural gas and consumed 113.8 Tcf. Unlike oil, more natural gas was produced than consumed, which is why natural gas prices were near-record lows in 2011 and 2012, while oil prices hovered near all-time highs. Natural gas is traded in million British thermal units (MMBtu).
Coal
Coal provides 30 percent of global energy needs, and in 2011, it was the fastest-growing form of fossil fuel energy. The world produced 7,678 million tonnes (Mt) of coal and consumed 7,217 Mt.
Not all coal is created equal. The most common type, bituminous coal, provides between 10,000 Btus and 15,000 Btus per pound. Coal that generates more heat per pound fetches higher prices.
Nuclear
Instead of burning fuel to produce steam, nuclear energy produces heat to create steam by controlling the continuous fission of uranium atoms. In 2011, nuclear energy generated more than 2,600 billion kilowatt-hours of electricity, or 4.9 percent of global primary energy production, requiring nearly 68,000 tonnes of uranium. As of 2013, 435 nuclear reactors were operating in the world, with 65 under construction and 167 planned.
Uranium is traded in contracts of 250 pounds. Prices ranged from $10 to $135 per pound between 2003 and 2013. As with all nonrenewable fuels, you can trade the commodity directly or invest in companies that produce it.
Hydroelectricity and other renewables
Renewable resources don’t require a finite source of fuel to produce energy. Instead, naturally occurring sources are captured and converted into usable forms of energy. The power of rivers and wind can spin turbines, heat from the earth’s core can make steam, and the sun’s rays can be converted into electricity.
Combined, hydroelectricity and other renewables accounted for almost 8 percent of global energy use in 2011, with hydro producing 3,500 billion kilowatt-hours and the others generating 860 billion kilowatt-hours. Because these renewables generate a much smaller percentage of total generation, they’re growing much faster than traditional sources of energy.
Global oil use, for example, grew by 0.7 percent in 2011, while wind energy grew 25.8 percent and solar grew 86.3 percent. Renewables’ growth when it comes to percentage of global generation is even faster, up 130 percent from 2001 to 2011, from 0.7 percent of generation to 1.6 percent of generation.
You can invest in this type of energy by buying the companies that make the necessary equipment, like solar panels and wind turbines, or the utilities that use them.
Major markets
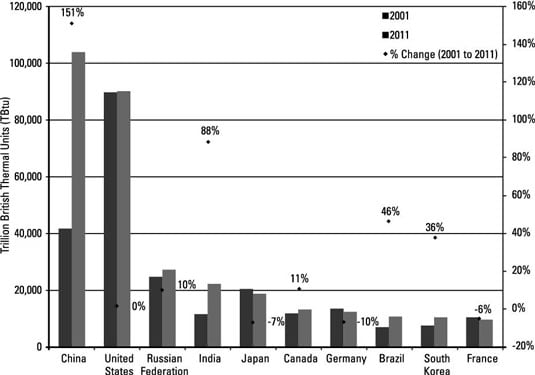
As of 2011, China passed the United States in terms of total energy consumed. On a per capita basis, however, the United States is far and away the world leader, consuming nearly twice as much per person as the nearest competitor, France. This figure shows the top total energy-consuming nations and how their consumption changed from 2001 to 2011.
Currently, all net growth in energy consumption is coming from emerging economies. Consumption in developed nations has actually declined over these past few recessionary years. China alone accounted for 71 percent of global energy consumption growth in 2011. This table shows regional markets for all sources of energy.
| Oil (Thousand Barrels per Day) | Natural Gas (Bcf/Day) | Coal (Thousand Short Tons) | Nuclear (Billion Kilowatt-hours) | Hydro (Billion Kilowatt-hours) | Renewables (Billion Kilowatt-hours) | |
|---|---|---|---|---|---|---|
| North America | 23,156 | 83.6 | 1,071,818 | 936.7 | 740.7 | 227.1 |
| South and Central America | 6,241 | 15.0 | 49,568 | 21.9 | 743.5 | 50.1 |
| Europe/Eurasia | 18,924 | 106.5 | 1,452,169 | 1,200 | 791.6 | 372.7 |
| Middle East | 8,076 | 39.0 | 16,811 | 0.1 | 21.9 | 0.4 |
| Africa | 3,336 | 10.6 | 214,972 | 12.7 | 103.6 | 5.5 |
| Asia Pacific | 28,301 | 57.1 | 5,338,369 | 477.3 | 1,096.5 | 205.0 |
This table shows regional production markets for nonrenewable resources. Renewables aren’t included because they’re consumed where they’re produced.
| Region | Oil (Thousand Barrels per Day) | Natural Gas (Bcf/Day) | Coal (Thousand Short Tons) | Nuclear (Tonnes of Uranium) |
|---|---|---|---|---|
| North America | 14,301 | 83.6 | 1,181,967 | 10,682 |
| South and Central America | 7,381 | 16.2 | 104,009 | 265 |
| Europe/Eurasia | 17,314 | 100.3 | 1,362,013 | 26,698 |
| Middle East | 27,690 | 50.9 | 1,294 | 0 |
| Africa | 8,804 | 19.6 | 284,279 | 9,037 |
| Asia Pacific | 8,086 | 46.4 | 5,527,345 | 7,928 |
| Total | 83,576 | 317.0 | 8,460,907 | 54,610 |