How to determine which data analysis to use in Statistics II
Statistics II is often about data analysis, and the trick is to know when to use which analysis method. The following table helps you compare, contrast, and decide what data analysis to use and when. Use it for an easy reference and to review for exams.
| Analysis | Purpose | When It’s Used |
|---|---|---|
| Simple linear regression | Use x to estimate y, using a line | Response variable y quantitative; constant variance across x, which is quantitative |
| Multiple regression | Use multiple x variables (x, i = 1 . . . , k) to estimate y using a plane |
y is quantitative; normal distribution for each xi combination with constant variance |
| Nonlinear regression | Use x to estimate y using a curve | y is quantitative; normal distribution; constant variance across x |
| Logistic regression | Use x to estimate p = probability of success of y |
y is a yes/no variable with success p |
| One-way ANOVA | Compare two population means using one factor | y is quantitative; factor is x |
| Tukey’s test | Multiple comparisons | Confidence intervals for all pairs of means; keeps error rates low |
| Fisher’s LSD test | Multiple comparisons | Confidence intervals for all pairs of means; overall error rate higher than Tukey’s |
| Scheffe’s method | Multiple comparisons | Looks at linear combinations of means, not just pairs |
| Bonferroni adjustment | Multiple comparisons | All pairs of t-tests adjusted for number of tests |
| Dunnetts’s test | Multiple comparisons | Experiments; compares treatment versus control only |
| Student Newman-Keuls test (SNK) | Multiple comparisons | Stepwise approach, comparing pairs ordered from smallest to largest |
| Duncan’s multiple range test (MRT) | Multiple comparisons | Adjusts SNK test for more power |
| Two-way ANOVA | Compare more than two population means, using two factors plus interaction |
y is quantitative; factors are (x1, x2) |
| Chi-square tests | Test independence of two variables or goodness-of-fit for one qualitative variable |
All variables qualitative |
| Sign/Signed rank tests | Test one population median | y is quantitative or ordinal (based on ranks) |
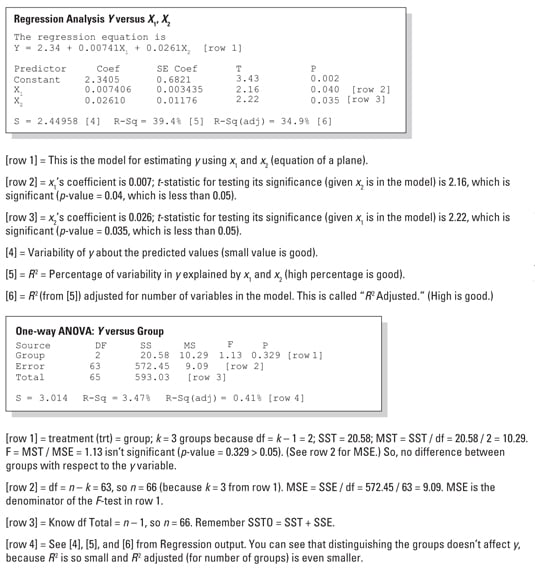
Computer output for Statistics II
If you’re taking Statistics II, you’re likely to face questions on computer output for multiple regression and ANOVA. Professors like to give output on exams and ask you to interpret it. Sometimes they leave empty spaces and ask you to fill them in using the info given. Reviewing the following output analyses can help.