
Entering your pie-chart data
To enter the data for a pie chart into your favourite spreadsheet program, follow these steps and look at the figure as you go along: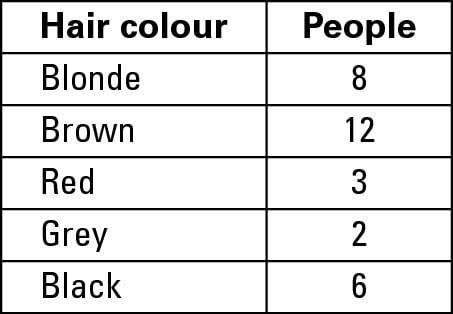
-
Open the spreadsheet program.
-
In the top-left cell, write the name of the categories you have.
For example, ‘hair colour’ or ‘client’. Select this row and make it bold by pressing control-B.
-
In the next cell to the right, write what the bar chart is measuring.
For example, ‘people’ or ‘income’.
-
Below the top-left cell, type in the categories.
For example, for the hair colour categories you may have ‘blonde’, ‘brown’, etc. For the people categories, you may have ‘Mr Smith’, ‘Mr Jones’ and so on.
-
Below each of the value labels, write the appropriate value for each category.
Your spreadsheet now has a table ripe for turning into a pie chart.
Drawing your pie chart
To draw your pie chart, you simply click the right buttons in the right menus. If your computer is a bit different, play about with options and menus that sound similar and see what happens – you won’t break the computer.To draw a pie chart:
-
Select the data, including the labels.
-
From the ‘Insert’ menu, pick ‘Chart . . .’.
-
In the dialogue box that appears, click ‘Pie Chart’.
-
Click ‘OK’ or ‘Finish’.
You should see a beautiful pie chart.