The word random is something folks use all the timeYou probably have some intuitive concept of randomness, but find may hard it to put into precise language. Random is a term that applies to the data you acquire in your experiments. You can talk about random events and random variables.
When talking about a sequence of numbers, random means the absence of any pattern in the numbers that could be used to predict what the next number will be.
The important idea is that you can't predict a specific outcome if randomness is involved. But that doesn't mean that you can't make any statements about a collection of random numbers. Statisticians can say a lot about how a group of random numbers behave collectively.
The first step in analyzing a set of data is to have a good idea of what the data looks like. This is the job of descriptive statistics — to show you how a set of values are spread around and to show you the relationship between two or more sets of values.
The basic tool for describing the distribution of values for some variable in a sample of subjects is the histogram, or frequency distribution graph. Histograms help you visualize the distributions of two types of variables:
Categorical: For categorical variables (such as gender or race), a histogram is simply a bar chart showing how many observations fall into each category, like the distribution of race in a sample of subjects (part a of the figure below).
Continuous: To make a histogram of a continuous variable (such as weight or blood hemoglobin), you divide the range of values into some convenient interval, count how many observations fall within each interval, and then display those counts in a bar chart, (part b of the figure shows the distribution of hemoglobin for a sample of subjects).
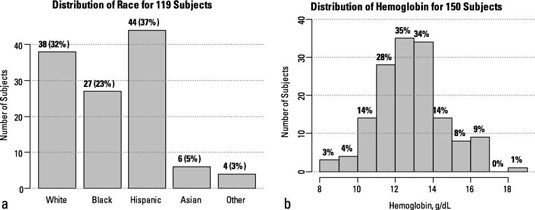
The y (vertical) axis of a histogram can be labeled as the count of the number of subjects in each category or interval, or as the percentage of the total number of subjects falling into each category or interval. The individual bars in a histogram can also be labeled at the top with a count or percentage (or both).