
Formulas — you just can’t get away from them when you’re studying statistics. Here are ten statistical formulas you’ll use frequently and the steps for calculating them.
Proportion
Some variables are categorical and identify which category or group an individual belongs to. For example, “relationship status” is a categorical variable, and an individual could be single, dating, married, divorced, and so on.
The actual number of individuals in any given category is called the frequency for that category. A proportion, or relative frequency, represents the percentage of individuals that falls into each category. The proportion of a given category, denoted by p, is the frequency divided by the total sample size.
So to calculate the proportion, you
Count up all the individuals in the sample who fall into the specified category.
Divide by n, the number of individuals in the sample.
Mean
The mean, or the average of a data set, is one way to measure the center of a numerical data set. The notation for the mean is
The formula for the mean is

where x represents each of the values in the data set.
To calculate the mean, you
Add up all the numbers in the data set.
Divide by n, the number of values in the data set.
Median
The median of a numerical data set is another way to measure the center. The median is the middle value after you order the data from smallest to largest.
To calculate the median, go through the following steps:
Order the numbers from smallest to largest.
For an odd amount of numbers, choose the one that falls exactly in the middle. You’ve pinpointed the median.
For an even amount of numbers, take the two numbers exactly in the middle and average them to find the median.
Sample standard deviation
The standard deviation of a sample is a measure of the amount of variability in the sample. You can think of it, in general terms, as the average distance from the mean. The formula for the standard deviation is
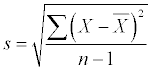
To calculate the standard deviation, you
Find the average of all the numbers,

Take each number and subtract the average from it.
Square each of the resulting values.
Add them all up.
Divide by n – 1.
Take the square root.
Percentile
Percentiles are a way to determine an individual value relative to all the other values in a data set. When taking a standardized test, you get an individual raw score and a percentile. If you come in at the 90th percentile, for example, 90 percent of the test scores of all students are the same as or below yours (and 10 percent are above yours). In general, being at the kth percentile means k percent of the data lie at or below that point and (100 – k) percent lie above it.
To calculate a percentile, you
Convert the original value to a standard score by using the z-formula,

where x is the original value,

is the population mean of all values, and

is the population standard deviation of all values.
Use the Z-table to find the corresponding percentile for the standard score.
Margin of error for the sample mean
The margin of error for your sample mean,
is the amount you expect the sample mean to vary from sample to sample. The formula for the margin of error for
dealing with samples of size 30 or more, is

where z* is the standard normal value for the confidence level you want.
To calculate the margin of error for
you
Determine the confidence level and find the appropriate z*.
Find the standard deviation

and the sample size, n.
Multiply z* by

divided by the square root of n.
Sample size needed
If you want to calculate a confidence interval for the population mean with a certain margin of error, you can figure out the sample size you need before you collect any data. The formula for the sample size for
is
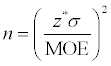
where z* is the standard normal value for the confidence level, MOE is your desired margin of error, and
is the standard deviation. Because
is an unknown value that you need, you may have to do a pilot study (small experimental study) to come up with a guess for the value of the standard deviation.
To calculate the sample size for
run through the following steps:
Multiply z* times s.
Divide by the desired margin of error, MOE.
Square it.
Round any fractional amount up to the nearest integer (so you achieve your desired MOE or better).
Test statistic for the mean
When conducting a hypothesis test for the population mean, you take the sample mean and find out how far it is from the claimed value in terms of a standard score. The standard score is called the test statistic. The formula for the test statistic for the mean is

where
is the claimed value for the population mean (the value that sits in the null hypothesis).
To calculate the test statistic for the sample mean for samples of size 30 or more, you
Calculate the sample mean,

and the sample standard deviation, s.
Take

Calculate the standard error,

Divide your result from Step 2 by the standard error found in Step 3.
Correlation
Sample correlation is a measure of the strength and direction of the linear relationship between two quantitative variables X and Y. It doesn’t measure any other type of relationship, and it doesn’t apply to categorical variables. The formula for correlation is
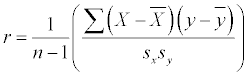
To calculate the correlation, you
Find the mean of all the x values and call it

Find the mean of all the y values and call it

Find the standard deviation of all the x values and call it sx. Find the standard deviation of all the y values and call it sy.
For each (x, y) pair in the data set, take x minus

and y minus

and multiply them together.
Add all these products together to get a sum.
Divide the sum by sx x sy.
Divide the result by n – 1 where n is the number of (x, y) pairs. (This is the same as multiplying by one over n – 1.)
Regression line
After examining a scatterplot between two numerical variables and calculating the sample correlation between the two variables, you might observe a linear relationship between them. In that case, it would be appropriate to estimate a regression line for estimating the value of the response variable (Y) given a value for the explanatory variable (X).
Before calculating the regression line, you need five summary statistics:
The mean of the x values
The mean of the y values
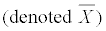
The standard deviation of the x values (denoted sx)
The standard deviation of the y values (denoted sy)
The correlation between X and Y (denoted r)
So, to calculate the best-fit regression line, you
Find the slope using the formula

Find the y-intercept using the formula

Piece together the results from Steps 1 and 2 to give you the regression line: y = mx + b.