
The normal distribution is a very friendly distribution that has a table for finding probabilities and anything else you need. For example, you can find probabilities for
by converting the
to a z-value and finding probabilities using the Z-table (see below).
The general conversion formula from
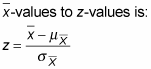
Substituting the appropriate values of the mean and standard error of
the conversion formula becomes:

Don’t forget to divide by the square root of n in the denominator of z. Always divide by the square root of n when the question refers to the average of the x-values.
For example, suppose X is the time it takes a randomly chosen clerical worker in an office to type and send a standard letter of recommendation. Suppose X has a normal distribution, and assume the mean is 10.5 minutes and the standard deviation 3 minutes. You take a random sample of 50 clerical workers and measure their times. What is the chance that their average time is less than 9.5 minutes?This question translates to finding
As X has a normal distribution to start with, you know
also has an exact (not approximate) normal distribution. Converting to z, you get:
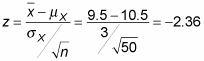
So you want P(Z < –2.36).

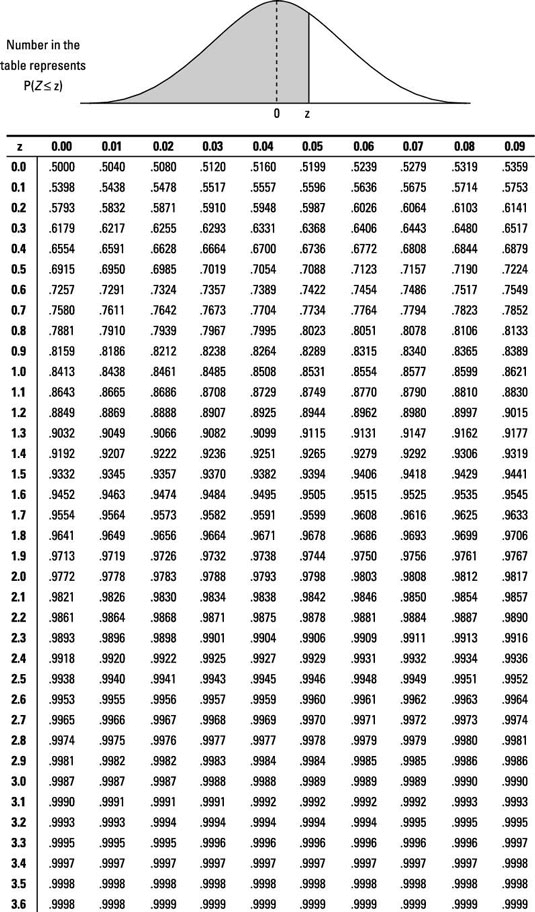
Using the above Z-table, you find that P(Z < –2.36)=0.0091. So the probability that a random sample of 50 clerical workers average less than 9.5 minutes to complete this task is 0.91% (very small).
How do you find probabilities for
if X is not normal, or unknown? As a result of the Central Limit Theorem (CLT), the distribution of X can be non-normal or even unknown and as long as n is large enough, you can still find approximate probabilities for
using the standard normal (Z-)distribution and the process described above. That is, convert to a z-value and find approximate probabilities using the Z-table.
When you use the CLT to find a probability for
(that is, when the distribution of X is not normal or is unknown), be sure to say that your answer is an approximation. You also want to say the approximate answer should be close because you’ve got a large enough n to use the CLT. (If n is not large enough for the CLT, you can use the t-distribution in many cases.)