
A percentile isn't a percent. A percent is a number between 0 and 100; a percentile is a value of X (a height, an IQ, a test score, and so on).
Certain percentiles are so popular that they have their own names and their own notation. The three "named" percentiles are Q1 — the first quartile, or the 25th percentile; Q2 — the 2nd quartile (also known as the median or the 50th percentile); and Q3 — the 3rd quartile or the 75th percentile.Here are the steps for finding any percentile for a normal distribution X:
-
If you're given the probability (percent) less than x and you need to find x, you translate this as: Find a where p(X < a) = p (and p is the given probability).
That is, find the pth percentile for X. Go to Step 2.
-
If you're given the probability (percent) greater than x and you need to find x, you translate this as: Find b where p(X > b) = p (and p is given).
Rewrite this as a percentile (less-than) problem: Find b where p(X < b) = 1 – p. This means find the (1 – p)th percentile for X.
-
Find the corresponding percentile for Z by looking in the body of the Z-table (see below) and finding the probability that is closest to p (from Step 1a) or 1 – p (from Step 1b).
Find the row and column this probability is in (using the table backwards). This is the desired z-value.
-
Change the z-value back into an x-value (original units) by using

You've (finally!) found the desired percentile for X. The formula in this step is just a rewriting of the z-formula,

so it's solved for x.
Being at the bottom 10 percent means you have a "less-than" probability that's equal to 10 percent, and you are at the 10th percentile.
Now go to Step 1 and translate the problem. In this case, because you're dealing with a "less-than" situation, you want to find x such that p(X < x) = 0.10. This represents the 10th percentile for X. The following figure shows a picture of this situation.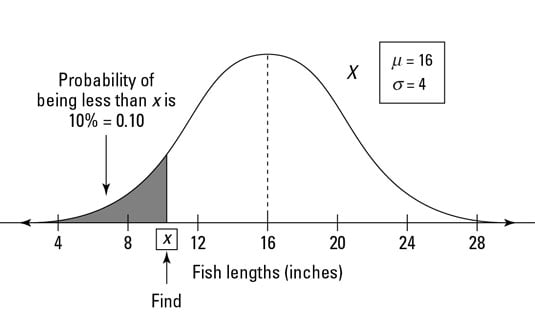

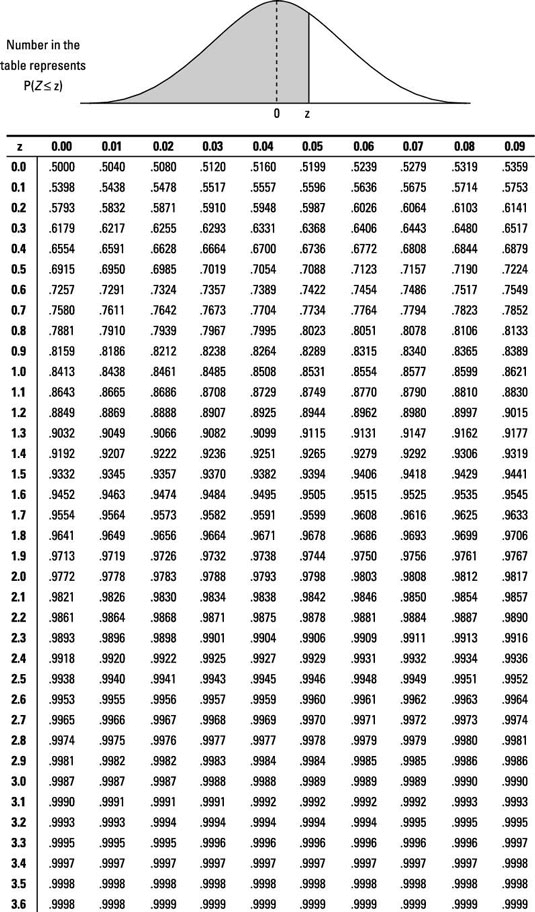
Looking in the body of the Z-table, the probability closest to 0.10 is 0.1003, which falls in the row for z = –1.2 and the column for 0.08. That means the 10th percentile for Z is –1.28. So, a fish whose length is 1.28 standard deviations below the mean marks the bottom 10 percent of all fish lengths in the pond.
But exactly how long is that fish, in inches? In Step 3, you change the z-value back to an x-value (fish length in inches) using the z-formula solved for x; you get x = 16 + –1.28[4] = 10.88 inches. So 10.88 inches marks the lowest 10 percent of fish lengths. Ten percent of the fish are shorter than that.