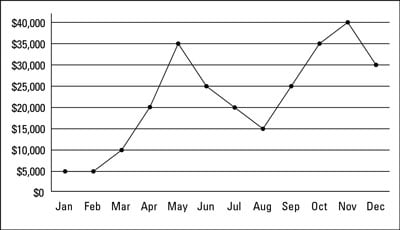
The line graph shows a progression in time. At a glance, you can tell that Tami’s business tended to rise strongly at the beginning of the year, drop off during the summer, rise again in the fall, and then drop off again in December.
Here are a few typical questions that you may be asked to show that you know how to read a line graph:
-
High or low points and timing: In what month did Tami bring in the most revenue, and how much did she bring in? Notice that the highest point on the graph is in November, when Tami’s revenue reached $40,000.
-
Total over a period of time: How much did she bring in altogether the last quarter of the year? A quarter of a year is three months, so the last quarter is the last three months of the year. Tami brought in $35,000 in October, $40,000 in November, and $30,000 in December, so her total receipts for the last quarter add up to $105,000.
-
Greatest change: In what month did the business show the greatest gain in revenue as compared with the previous month? You want to find the line segment on the graph that has the steepest upward slope. This change occurs between April and May, where Tami’s revenue increased by $15,000, so her business showed the greatest gain in May.