
You use the total probability of each event to work out the probability of each pair of events. Here’s how to draw your probability table:
-
Count how many possible outcomes the first event has.
Your table needs that many columns, plus another two.
-
Count how many possible outcomes the second event has.
Your table needs that many rows, plus another two.
-
Draw a table with the appropriate number of rows and columns.
-
Label the columns.
Leave the first column blank and then list the outcomes for the first event, followed by ‘total’ in the final column.
-
Label the rows.
Leave the first row blank and then list the outcomes for the second event, followed by ‘total’ in the final row.
-
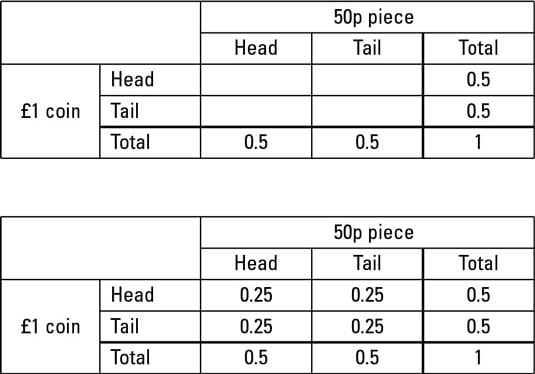
The total of all the probabilities has to be one, so put 1 in the ‘total/total’ cell in the bottom right.
-
Find the probability of one of the events and write it in the ‘total’ box for that row or column.
Do the same for the other event.
-
Find the probability of a combined event.
If you already know this probability, write it in the right box. If not, times the two ‘total’ numbers you worked out in Step 7 and write the answer in the box in the same row and column as both.
-
Fill in the remaining boxes.
The cells in any row or column have to add up to the ‘total’ at the end or bottom of it.