You can use the slope-intercept form to graph inequalities. The slope-intercept form is expressed as y = mx + b, where the variable m stands for the slope of the line, and b stands for the y-intercept (or where the line crosses the y-axis).
You can change equations that aren’t written in slope-intercept form by solving for y. For example, graphing 2x – 3y = 12 requires you to subtract 2x from both sides first to get –3y = –2x + 12. Then you divide every term by –3 to get
This graph starts at (0,–4) on the y-axis; to find the next point, you move up two and right three (using the slope). This gets you to the point (3,-2). Slope is often expressed as a fraction because it’s rise over run — in this case 2/3.
Inequalities are used for comparisons, which are a big part of pre-calculus. They show a relationship between two expressions (greater than, less than, or equal to). Graphing inequalities starts exactly the same as graphing equalities, but at the end of the graphing process (you still put the equation in slope-intercept form and graph), you have two decisions to make:
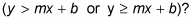
Is the line dashed, meaning y < mx+b or y > mx+b, or is the line solid, meaning

Do you shade under the line
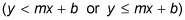
or do you shade above the line
For inequalities, you show all possible solutions by shading the side of line that works in the original equation.
For example, when graphing y < 2x – 5, you follow these steps:
Start off at –5 on the y-axis and mark a point.
Move up two and right one to find a second point.
When connecting the dots, you produce a straight dashed line.
Shade on the bottom half of the graph to show all possible points in the solution.