If your pre-calculus teacher asks you to estimate the limit of a function analytically, you can simply set up a chart and put the number that x is approaching smack dab in the middle of it. Then, coming in from the left in the same row, systematically choose numbers that get closer to the number. Do the same thing coming in from the right. In the next row, you compute the corresponding y values.
Solving analytically is the long way of estimating a limit, but sometimes you'll come across a function (or teacher) that requires this technique, so it's good for you to know. When you can't find the limit algebraically, you're stuck with this method. In typical mathematical style, instructors always teach you the long way before showing you a shortcut.
For example, this function is undefined at x = 4 because that value makes the denominator 0:
But you can estimate the limit of the function as x approaches 4 by using a chart. This table shows how to set it up.
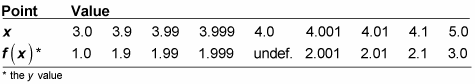
The values that you pick for x are completely arbitrary — they can be anything you want. Just make sure they get closer and closer to the value at which you are taking the limit from both directions. The closer you get to the actual x value, though, the closer your limit is as well. If you look at the y values in the chart, you'll notice that they appear to be getting closer and closer to 2 from both sides; so 2 is the estimated limit of the function as x approaches 4, determined analytically.
You can easily make this chart with a calculator and its table feature. Look in the manual for your particular calculator to discover how. Often you just need to input the function's equation into "y =" and find a button that says "table." Handy!