Sometimes a data set contains a large number of repeated values. In these situations, you can simplify the process of computing the mean by using weights — the frequencies of a value in a sample or a population. You can compute the arithmetic mean as a weighted average.
The formula for computing a weighted arithmetic mean for a sample or a population is
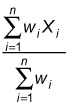
Here, wi represents the weight associated with element Xi; this weight equals the number of times that the element appears in the data set.
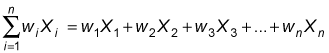
The numerator (the top half of the formula) tells you to multiply each element in the data set by its weight and then add the results together, as shown here:
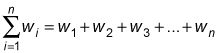
The denominator (the bottom half of the formula) tells you to add the weights together:
You find the weighted arithmetic mean by dividing the numerator by the denominator.
As an example, suppose that a marketing firm conducts a survey of 1,000 households to determine the average number of TVs each household owns. The data show a large number of households with two or three TVs and a smaller number with one or four. Every household in the sample has at least one TV and no household has more than four. Here's the sample data for the survey:
| Number of TVs per Household | Number of Households |
|---|---|
| 1 | 73 |
| 2 | 378 |
| 3 | 459 |
| 4 | 90 |
Because many of the values in this data set are repeated multiple times, you can easily compute the sample mean as a weighted mean. Doing so is quicker than summing each value in the data set and dividing by the sample size.
Follow these steps to calculate the weighted arithmetic mean:
Assign a weight to each value in the data set:
X1 = 1, w1 = 73
X2 = 2, w2 = 378
X3 = 3, w3 = 459
X4 = 4, w4 = 90
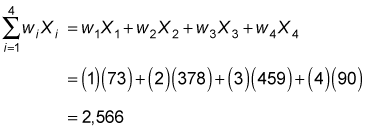
Compute the numerator of the weighted mean formula.
Multiply each sample by its weight and then add the products together:
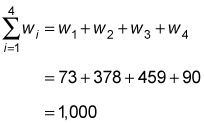
Compute the denominator of the weighted mean formula by adding the weights together:
Divide the numerator by the denominator:
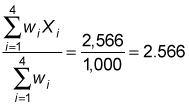
The mean number of TVs per household in this sample is 2.566.